The Iowa Environmental Mesonet (IEM) collects environmental data from cooperating members with observing networks. The data are stored and made available on this website.

IEM Daily Feature

Awaiting Last Inch

Posted: 10 Mar 2026 05:30 AM, Views: 679
The spectacular weather on Sunday continued into Monday with record high temperatures set at a number of locations across Iowa and beyond. The calendar says we are still within the second week of March, so there is plenty of time yet for the chance of winter-like weather. The featured chart looks into an aspect of that by plotting the last cold season date of at least an inch of snow reported for Des Moines. The yearly value is plotted along with a line until the date when snow cover was no longer reported (~ how long the snow stuck around). This combination is colorized by the number of days with red values indicating the shortest duration. The left panel black line plots the accumulated frequency of the last date. The 10 March value is somwhere just below 50%, so over half of the previous years on record reported at least a single one inch snowfall event or larger after 10 March. The right hand plot presents the date by year with two trend lines shown. A number of recent years have seen such snows into mid April and even early May, but these late season events struggle to stick around long as ever warming soils, lengthening days, and increased solar inputs act to quickly melt the snow away.
Rate Feature

Previous Years' Features
De Witt (US 30/US 61), IA Webcam:
News Items  

Tracking TAF Amendments
Posted: 13 Feb 10:28 AM

IEM Archival Update
Posted: 24 Sep 11:07 PM

TAF Archive Fixes
Posted: 22 Aug 7:28 AM

Website Update
Posted: 13 Jun 12:45 PM

New IEM LSR App
Posted: 22 May 11:15 AM

Sign up for the Daily Bulletin

Current Website Performance:
Bandwidth: 70.1 MB/s
Total Website: 3,908 req/s
API/Data Services: 170.7 req/s
API Success: 100%

Soil Temperatures

Data from the Iowa State Soil Moisture Network is found on this website and daily soil temperature averages are used to produce the highlighted analysis.

Precipitation

More Precipitation Maps

Current Data

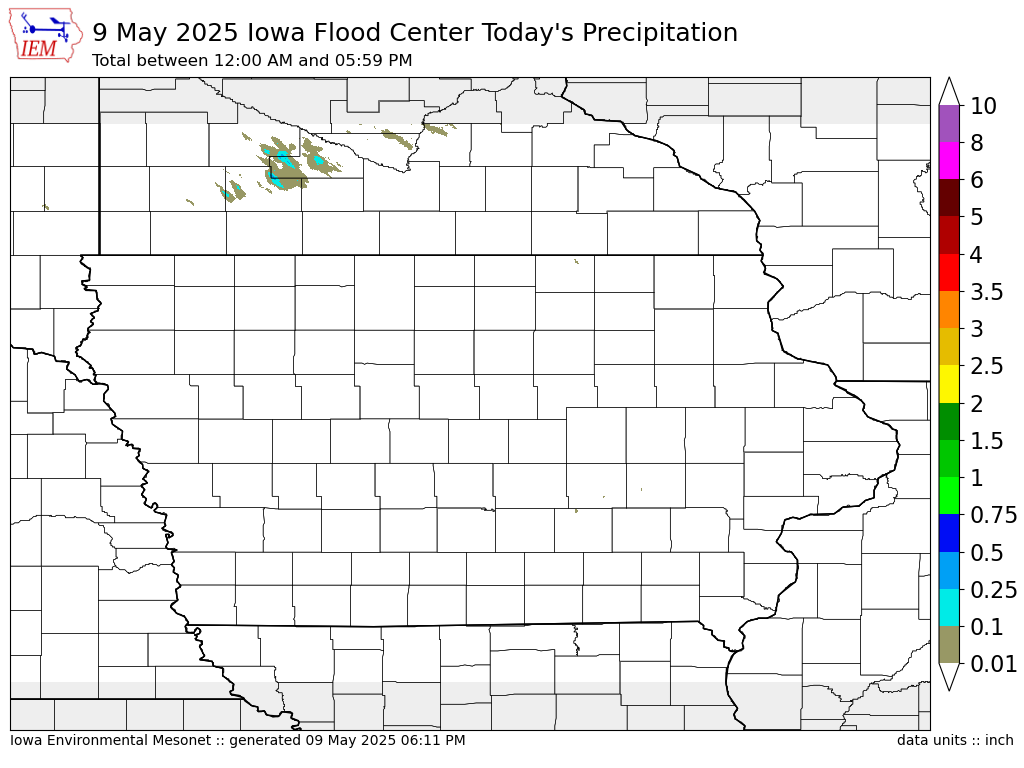
The IEM combines data from participating networks into products like maps shown above and web applications to analyze the data.

More current products »