Automated Data Plotter
This application dynamically generates many types of graphs derived from various IEM data sources. Feel free to use these generated graphics in whatever way you wish.
1 Select a Chart Type
2 Configure Chart Options
Plot Description:
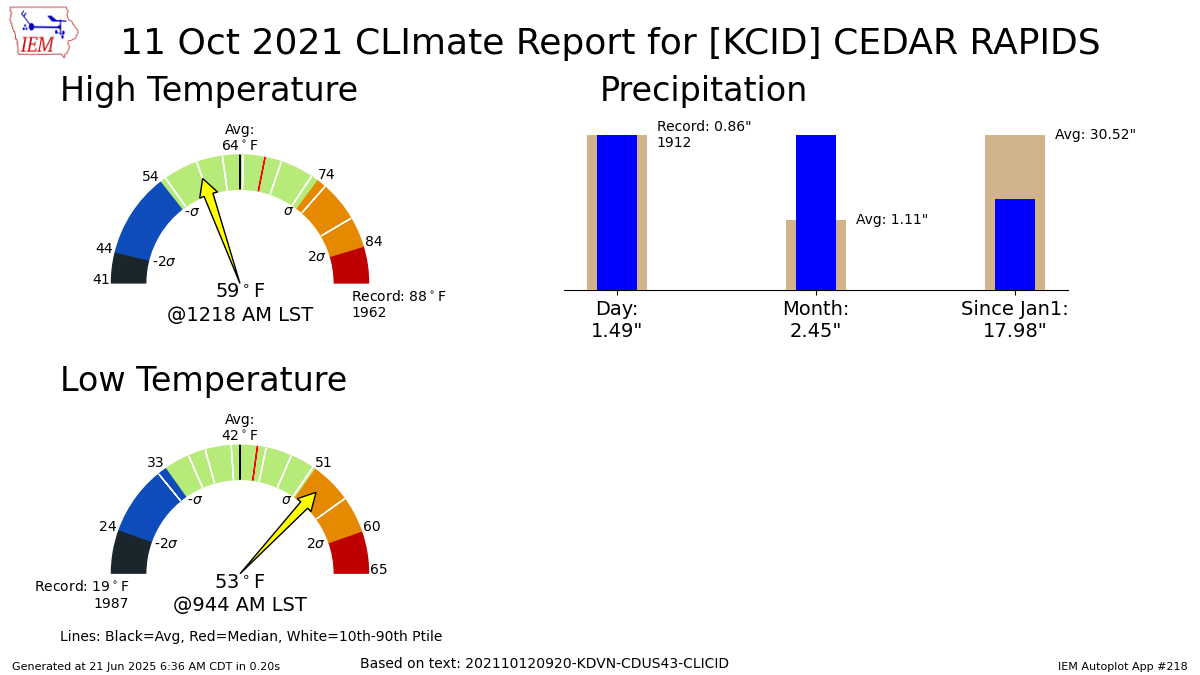
This produces an infographic with some of the information found presented in NWS CLI reports.The high and low temperature gauges contain some extra statistical information based on the period of record observations for the site. Sometimes this period of record information comes from a nearby weather station. This informatiom also provides the coldest high temperature and warmest low temperature, both of which are not found within the raw CLI text product.
3 Generated Chart
Based on recent timings, plot generation averages 2 seconds. Please wait while your chart is being generated...
IEM Daily Features using this plot
The IEM Daily Features found on this website often utilize plots found on this application. Here is a listing of features referencing this plot type.
- 23 Apr 2025: Earth Day 2025
- 09 Aug 2023: About Average Summer Day
- 12 Oct 2021: New Daily Record
- 29 Jul 2021: Daily Climate Report