Automated Data Plotter
This application dynamically generates many types of graphs derived from various IEM data sources. Feel free to use these generated graphics in whatever way you wish.
1 Select a Chart Type
2 Configure Chart Options
Plot Description:
Presently, this autoplot is a backend for generating Local Storm Report social media graphics. You have to know the associated NWS text product id for it to be of any usage. Perhaps this autoplot will become more useful in the future for interactive use!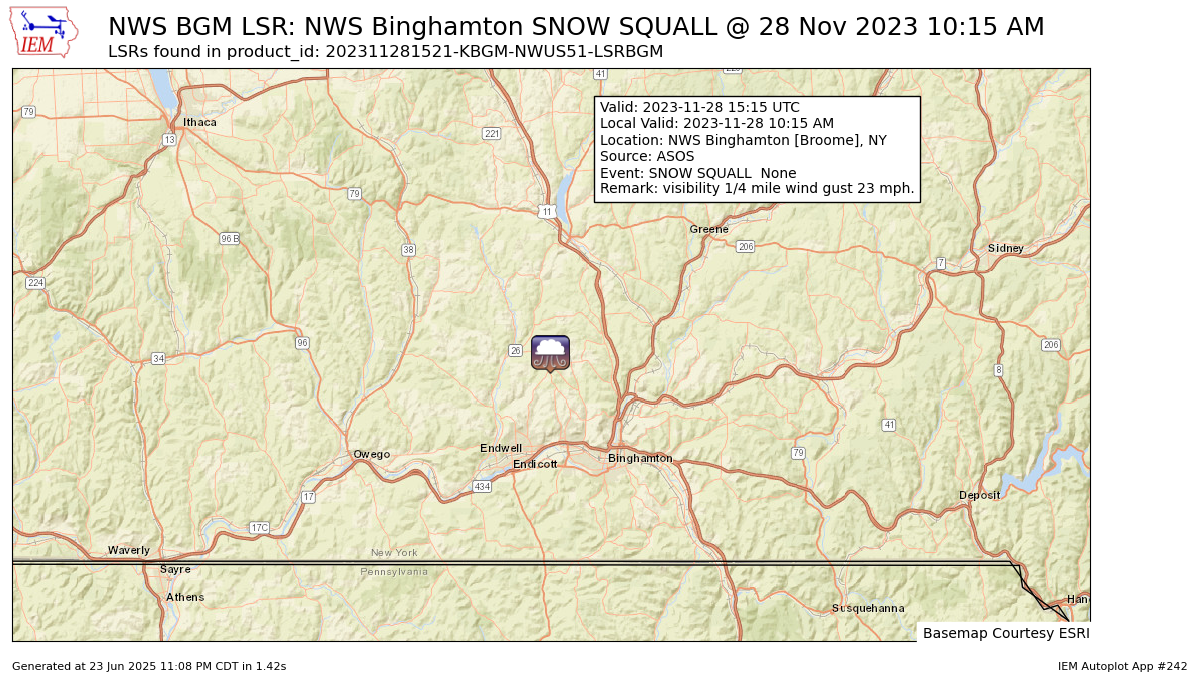
If you notice plotting issues with the image above, please
contact us
and provide the URL address currently shown by your web browser.
IEM Daily Features using this plot
The IEM Daily Features found on this website often utilize plots found on this application. Here is a listing of features referencing this plot type.
- 28 Nov 2023: Snow Squall Reports