Automated Data Plotter
This application dynamically generates many types of graphs derived from various IEM data sources. Feel free to use these generated graphics in whatever way you wish.
1 Select a Chart Type
2 Configure Chart Options
Plot Description:
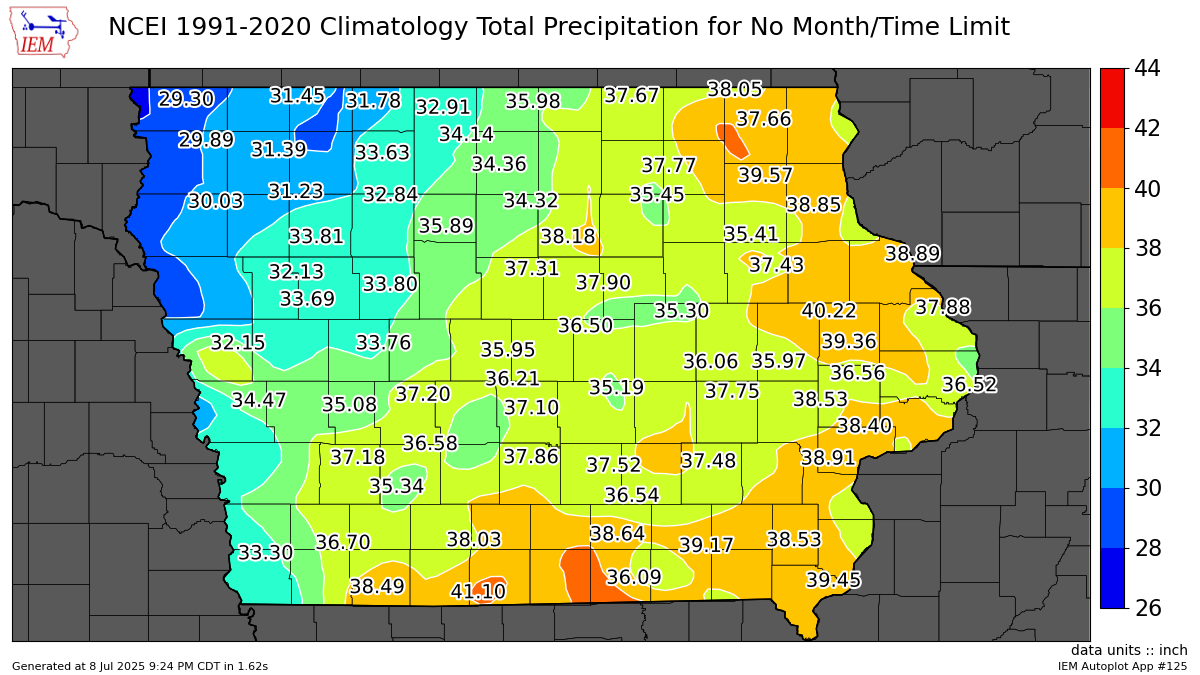
This application produces map analysis of climatological averages. The IEM maintains a number of different climatologies based on period of record and source. If you pick the NCEI Climatology, only basic temperature and precipitation variables are available at this time.If you select a period of dates with the end date prior to the start date, the logic then has the period cross the 1 January boundary. For example, a period between Dec 15 and Jan 15 will be computed.
3 Generated Chart
Based on recent timings, plot generation averages 3 seconds. Please wait while your chart is being generated...
If you notice plotting issues with the image above, please
contact us
and provide the URL address currently shown by your web browser.
IEM Daily Features using this plot
The IEM Daily Features found on this website often utilize plots found on this application. Here is a listing of features referencing this plot type.
- 19 Nov 2024: November Snow Climo
- 14 Nov 2023: Doing well for mid November
- 25 Jul 2023: This week of July Highs
- 19 Jul 2021: July Precip Climatology
- 19 Nov 2019: November Lows
- 09 Jan 2018: Doing Well for January Highs
- 16 Feb 2016: February Averages