Automated Data Plotter
This application dynamically generates many types of graphs derived from various IEM data sources. Feel free to use these generated graphics in whatever way you wish.
1 Select a Chart Type
2 Configure Chart Options
This data presentation utilizes the
USDA NASS Quickstats.
This presentation is not endorsed nor certified by USDA.
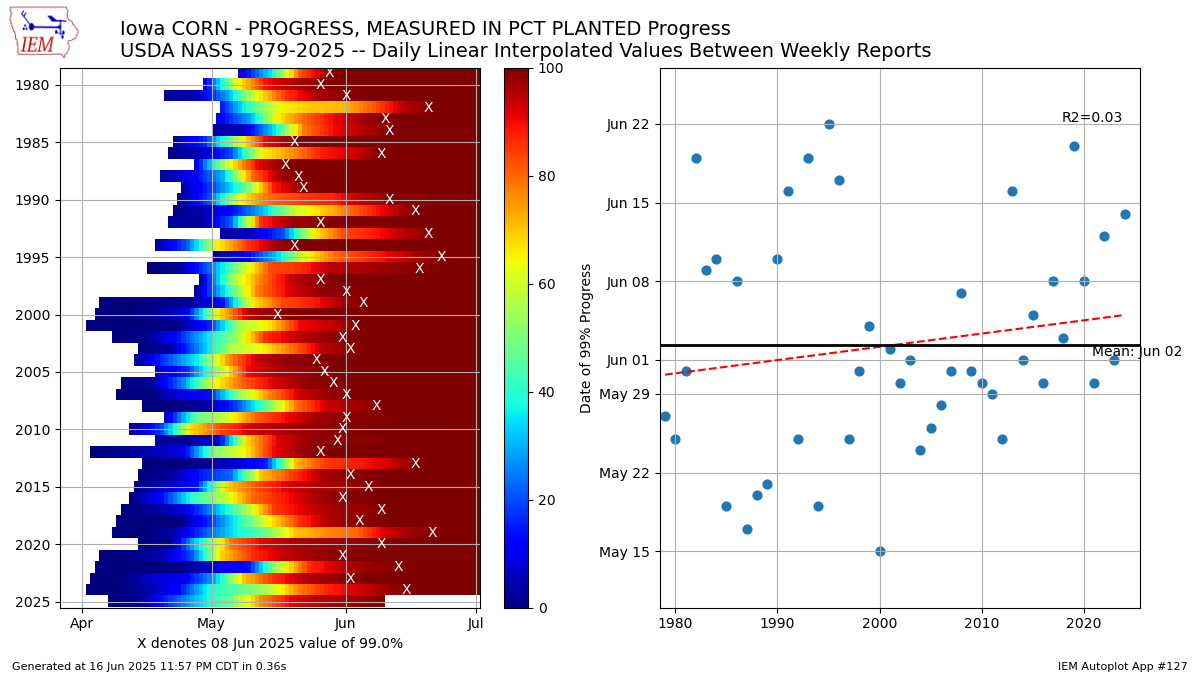
Plot Description:
This chart presents the crop progress by year. Since the NASS data is weekly, a linear interpolation is performed to estimate the daily values. The chart presents a yearly trendline as well for a given threshold value. Due to leap days, the plotted day of year values are not an exact science.3 Generated Chart
Based on recent timings, plot generation averages 2 seconds. Please wait while your chart is being generated...
If you notice plotting issues with the image above, please
contact us
and provide the URL address currently shown by your web browser.
IEM Daily Features using this plot
The IEM Daily Features found on this website often utilize plots found on this application. Here is a listing of features referencing this plot type.
- 17 Apr 2024: 4% Complete
- 26 Sep 2023: 2023 Corn Harvest Progress
- 04 Jul 2023: Knee High by Fourth of July
- 03 May 2023: Days Suitable for Field Work
- 17 Nov 2022: 95% Corn Harvest Done
- 06 Jul 2022: Emerged Soybeans
- 18 Nov 2020: 97% Done
- 29 Apr 2020: Great Start for Corn Planting
- 24 Oct 2019: Another Late Soybean Harvest
- 05 Sep 2019: Soybeans Setting Pods
- 04 Sep 2019: 2019 Corn Denting Progress
- 02 May 2019: Illinois Corn Progress
- 28 Nov 2018: Tough Soybean Harvest
- 28 Sep 2017: 2017 Corn Harvest Progress
- 07 Sep 2017: Corn Denting Progress
- 27 Apr 2017: 2017 Corn Planting Progress
- 20 Oct 2016: Soybean Harvest Progress
- 04 May 2016: Corn Emergence
- 20 Apr 2016: 2016 Corn Planting Progress
- 05 Nov 2014: Yearly Corn Harvest Progress