Automated Data Plotter
This application dynamically generates many types of graphs derived from various IEM data sources. Feel free to use these generated graphics in whatever way you wish.
1 Select a Chart Type
2 Configure Chart Options
Plot Description:
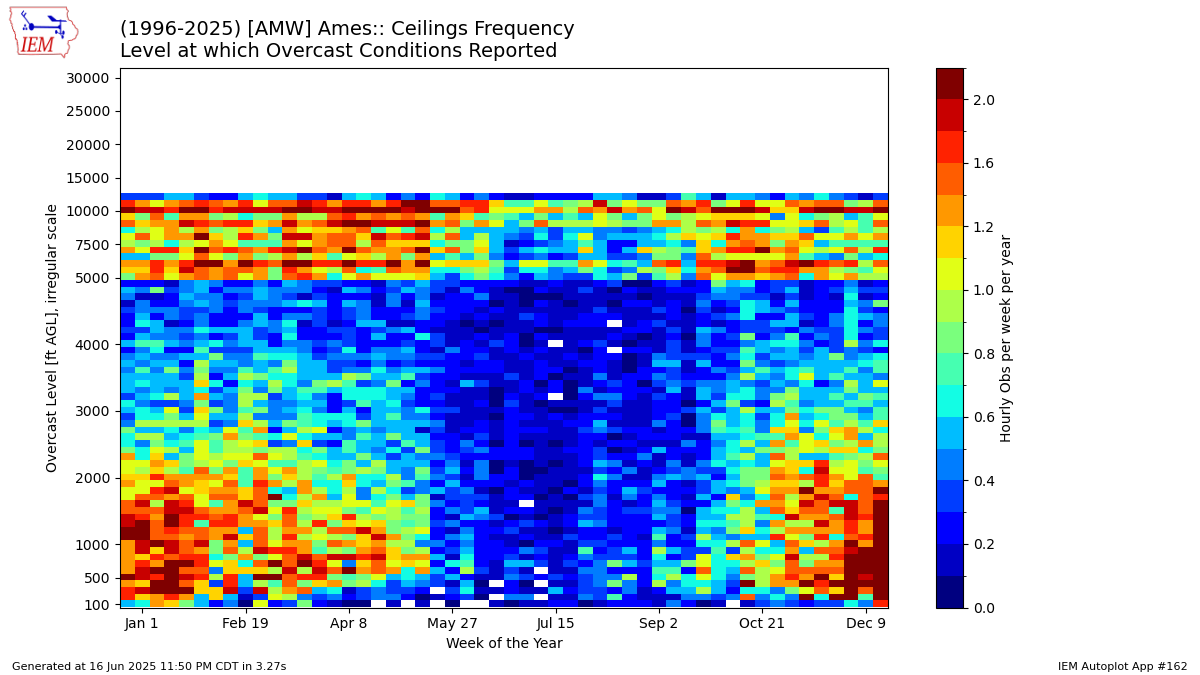
This plot presents a 2-D histogram of reported cloud ceilings as inferred by the METAR cloud amount reports of at least BKN (broken) or OVC (overcast) from the automated sensor. Please note that the yaxis uses an irregular spacing.3 Generated Chart
Based on recent timings, plot generation averages 9 seconds. Please wait while your chart is being generated...
If you notice plotting issues with the image above, please
contact us
and provide the URL address currently shown by your web browser.
IEM Daily Features using this plot
The IEM Daily Features found on this website often utilize plots found on this application. Here is a listing of features referencing this plot type.
- 20 Nov 2025: Cedar Rapids Ceilings
- 19 Oct 2023: Davenport Ceilings
- 11 Jan 2022: Ames Ceilings
- 22 May 2020: Done with Gloom Soon?
- 31 Oct 2018: Increasing Gloomy Days
- 03 Jan 2017: Winter Low Ceilings
- 24 Oct 2013: Ceilings