Automated Data Plotter
This application dynamically generates many types of graphs derived from various IEM data sources. Feel free to use these generated graphics in whatever way you wish.
1 Select a Chart Type
2 Configure Chart Options
Plot Description:
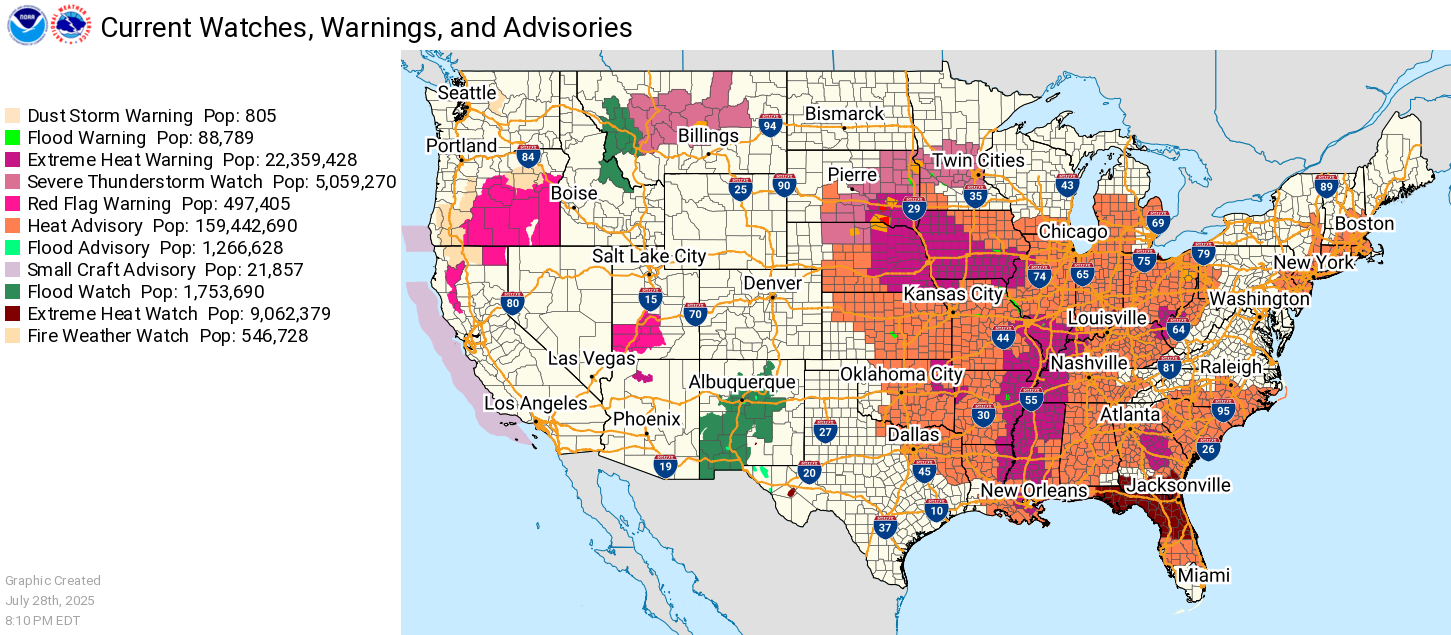
This autoplot generates a map of active NWS Watch, Warnings, and Advisories active at the given timestamp.Footnote on "Active" WaWA: A more complex than it should be nuance to explain here is the concept of what is "active" at a given timestamp. Let us consider a real world example. On Monday afternoon, the NWS issues a Winter Storm Warning for an upcoming storm that goes "into effect" at noon on Tuesday. You request this plot for a timestamp of 6 PM on that Monday. Is the Winter Storm Warning included in this metric at that time?
- Yes, if you select the option to include any WaWA that have been created, but may have an VTEC start time in the future yet.
- No, if you select the option to only include WaWA that have an issuance time before the given timestamp.
The default setting here is the first option, to include any events that have been created, but not necessarily having an issuance time prior to the given timestamp. This is why we can't have nice things!
If you turn on statistics, the legend displays active events nationwide. Central Region NWS maintains a similar map, but is near real-time only.
Autoplot 224 is closely related to this app and provides a table of stats.
3 Generated Chart
Based on recent timings, plot generation averages 15 seconds. Please wait while your chart is being generated...

IEM Daily Features using this plot
The IEM Daily Features found on this website often utilize plots found on this application. Here is a listing of features referencing this plot type.
- 28 Nov 2025: Hot Pink and Black Friday
- 24 Mar 2024: Busy Map