Automated Data Plotter
This application dynamically generates many types of graphs derived from various IEM data sources. Feel free to use these generated graphics in whatever way you wish.
1 Select a Chart Type
2 Configure Chart Options
Plot Description:
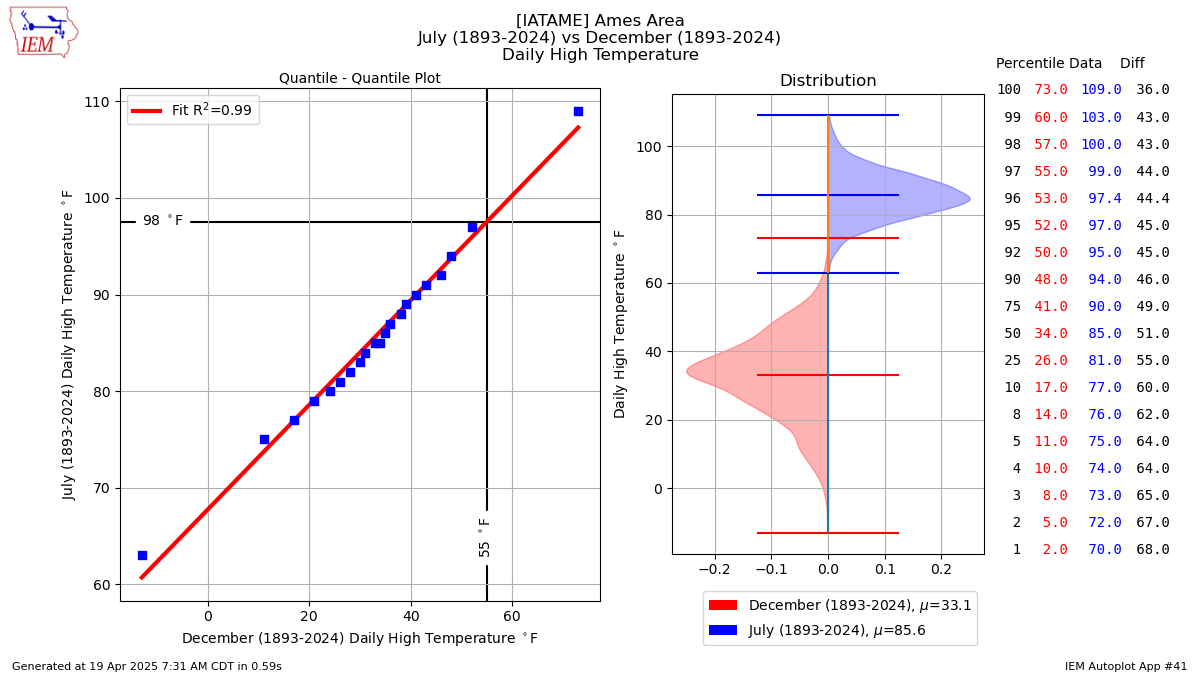
This plot compares the distribution of daily temperatures for two months or periods for a single station of your choice. The left hand plot depicts a quantile - quantile plot, which simply plots the montly percentile values against each other. You could think of this plot as comparable frequencies. The right hand plot depicts the distribution of each month's temperatures expressed as a violin plot. These type of plots are useful to see the shape of the distribution. These plots also contain the mean and extremes of the distributions.There is an additional bit of functionality allowing for the computation of metrics over a number of trailing days. When this trailing day window period is set to a value larger than 1 day, you will want to also set the computation method over that window. The options are:
- Max: Take the day with the highest value
- Avg: Take the average of all days in the window
- Min: Take the lowest value over the window
Clever combinations of the above allow for assessment of strength and duration of stretches of hot or cold weather.
3 Generated Chart
Based on recent timings, plot generation averages 2 seconds. Please wait while your chart is being generated...
If you notice plotting issues with the image above, please
contact us
and provide the URL address currently shown by your web browser.
IEM Daily Features using this plot
The IEM Daily Features found on this website often utilize plots found on this application. Here is a listing of features referencing this plot type.
- 17 Oct 2025: Jul vs Oct Highs
- 22 Feb 2024: Feb vs Jul Highs
- 10 Aug 2023: Aug vs Sep Highs
- 03 Nov 2021: Nov vs Oct Highs
- 04 Dec 2020: December Comparables
- 20 Dec 2019: 40 is like 90
- 16 Jan 2019: Comparing January 34 to July
- 26 Jun 2017: Comparable January Low
- 23 Mar 2017: March Changes
- 13 Dec 2016: May Comparables
- 27 Aug 2015: January Comparables
- 12 Dec 2014: 55 is like 98