Automated Data Plotter
This application dynamically generates many types of graphs derived from various IEM data sources. Feel free to use these generated graphics in whatever way you wish.
1 Select a Chart Type
2 Configure Chart Options
Plot Description:
Computes the frequency of having an overcast sky reported. There are a number of caveats to this plot as sensors and observing techniques have changed over the years! The algorithm specifically looks for the OVC condition to be reported in the METAR observation. For a month of a year to be considered within the plot, at least 80% of the available observations for that month need to have sky cover reported.3 Generated Chart
Based on recent timings, plot generation averages 24 seconds. Please wait while your chart is being generated...
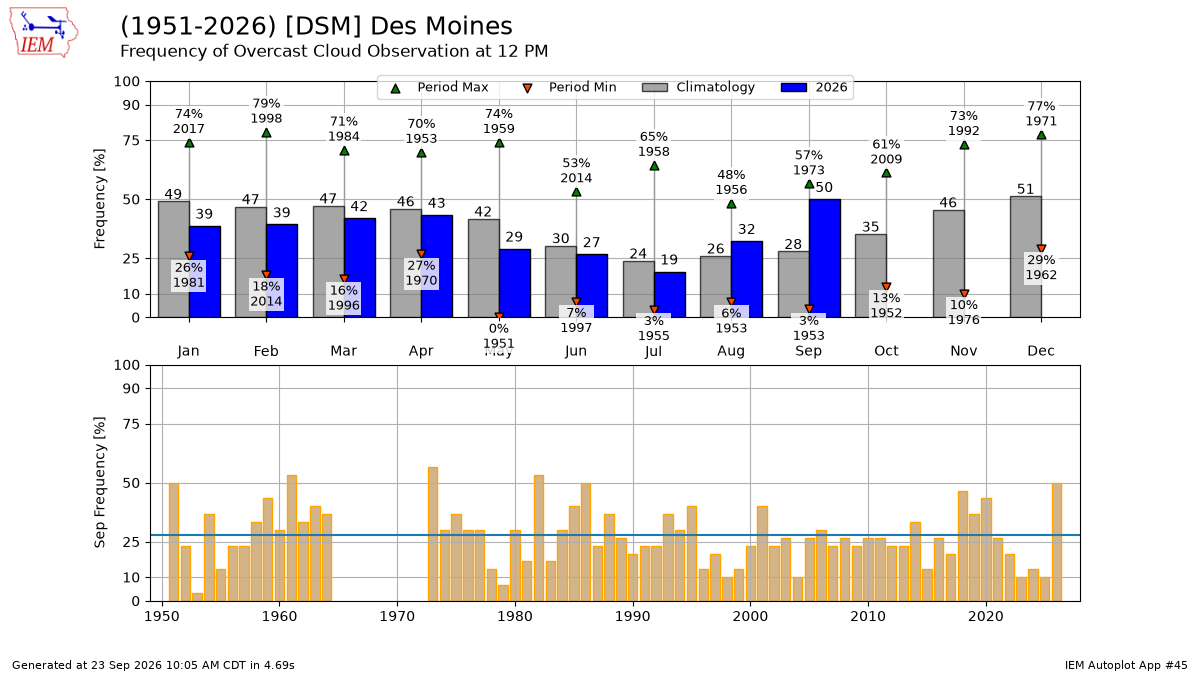
If you notice plotting issues with the image above, please
contact us
and provide the URL address currently shown by your web browser.
IEM Daily Features using this plot
The IEM Daily Features found on this website often utilize plots found on this application. Here is a listing of features referencing this plot type.
- 23 Sep 2026: Cloudy September
- 28 Oct 2025: October Overcast
- 11 Mar 2024: Another sunny month
- 15 Mar 2022: March Overcast
- 06 Jan 2021: January Cloudiness
- 29 Jan 2020: Plenty of Clouds
- 29 Jun 2018: Cloudy June
- 15 Nov 2017: November Cloudiness
- 23 Jan 2017: Overcast January
- 25 Feb 2016: Overcast early morning
- 23 Dec 2015: Gloomy at noon
- 22 Dec 2014: Overcast at noon