| May 2025 | Jun 2025 | Jul 2025 | ||||
|---|---|---|---|---|---|---|
| Sunday | Monday | Tuesday | Wednesday | Thursday | Friday | Saturday |
| 01 High: 86 Low: 59 Precip: 0.00 Avg Wind: SSW @ 1.5 RH% Min/Max: 51-100 Feel Min/Max: 60 to 89 | 02 High: 88 Low: 62 Precip: 0.00 Avg Wind: SSE @ 1.4 RH% Min/Max: 50-100 Feel Min/Max: 62 to 92 | 03 High: 89 Low: 68 Precip: 0.00 Avg Wind: S @ 5.2 Gust: S @ 21 (3:15 PM) RH% Min/Max: 57-100 Feel Min/Max: 68 to 95 | 04 High: 89 Low: 72 Precip: 0.71 Avg Wind: S @ 2.7 Gust: WSW @ 25 (4:09 PM) RH% Min/Max: 63-100 Feel Min/Max: 72 to 99 | 05 High: 90 Low: 71 Precip: 0.00 Avg Wind: SW @ 1.9 RH% Min/Max: 66-100 Feel Min/Max: 71 to 102 | 06 High: 87 Low: 72 Precip: 0.01 Avg Wind: WSW @ 3.7 Gust: WNW @ 18 (10:45 AM) RH% Min/Max: 65-100 Feel Min/Max: 72 to 95 | 07 High: 91 Low: 71 Precip: 0.04 Avg Wind: SW @ 5.0 Gust: SSW @ 24 (3:50 PM) RH% Min/Max: 66-100 Feel Min/Max: 72 to 105 |
| 08 High: 90 Low: 71 Precip: 0.00 Avg Wind: SW @ 4.4 RH% Min/Max: 57-100 Feel Min/Max: 71 to 98 | 09 High: 89 Low: 68 Precip: 0.00 Avg Wind: WSW @ 4.2 Gust: WSW @ 17 (3:56 AM) RH% Min/Max: 57-100 Feel Min/Max: 72 to 95 | 10 High: 91 Low: 61 Precip: 0.00 Avg Wind: SW @ 1.2 RH% Min/Max: 38-100 Feel Min/Max: 62 to 91 | 11 High: 87 Low: 67 Precip: 0.02 Avg Wind: NE @ 1.1 RH% Min/Max: 61-100 Feel Min/Max: 67 to 91 | 12 High: 78 Low: 69 Precip: 1.05 Avg Wind: NE @ 1.9 RH% Min/Max: 90-100 Feel Min/Max: 69 to 76 | 13 High: 88 Low: 72 Precip: Trace Avg Wind: SSW @ 5.5 RH% Min/Max: 61-100 Feel Min/Max: 72 to 95 | 14 High: 89 Low: 70 Precip: 0.04 Avg Wind: WSW @ 3.6 Gust: NW @ 31 (4:55 PM) RH% Min/Max: 66-100 Feel Min/Max: 71 to 102 |
| 15 High: 91 Low: 68 Precip: 0.78 Avg Wind: SSW @ 4.0 Gust: SSW @ 26 (7:47 PM) RH% Min/Max: 62-100 Feel Min/Max: 69 to 102 | 16 High: 85 Low: 72 Precip: 0.18 Gust: W @ 18 (1:20 PM) RH% Min/Max: 72-100 Feel Min/Max: 72 to 95 | 17 Precip: M | 18 | 19 | 20 | 21 |
| 22 | 23 | 24 | 25 | 26 | 27 | 28 |
| 29 | 30 | 01 | 02 | 03 | 04 | 05 |
The data presented here provided by IEM API webservice: daily.json. A simple CSV option exists as well.
Daily High/Low Plot
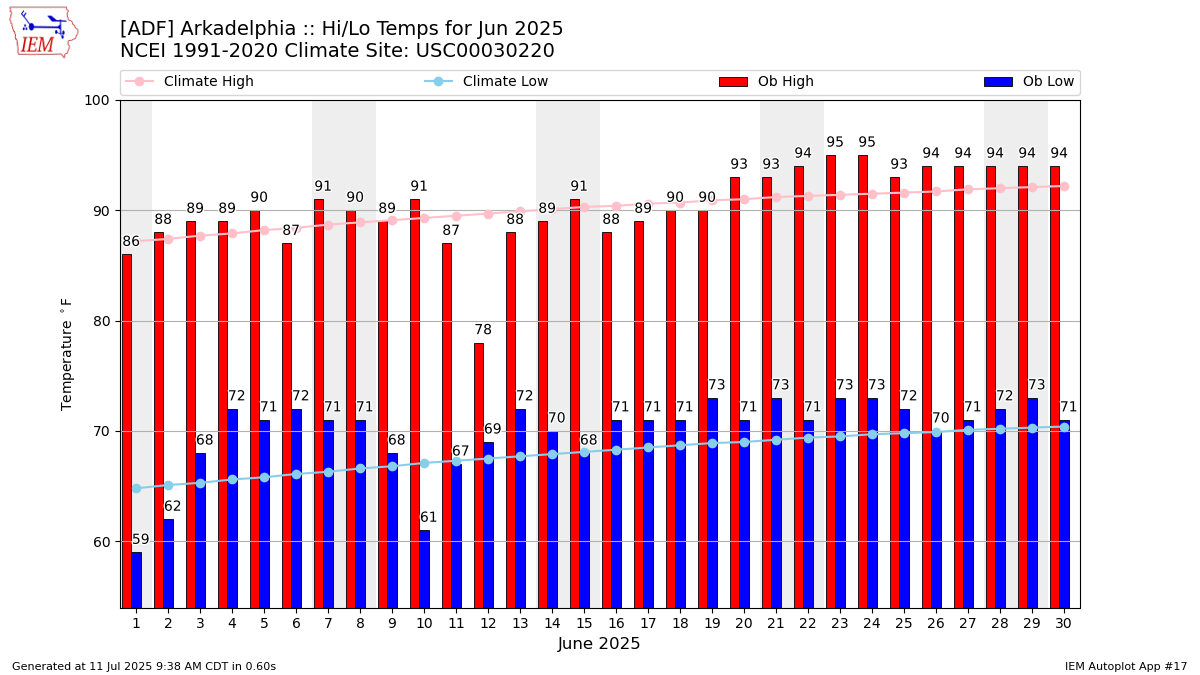
Description: This chart of the monthly temperature data. The bars are the observations and the dots are climatology.
Daily Rainfall
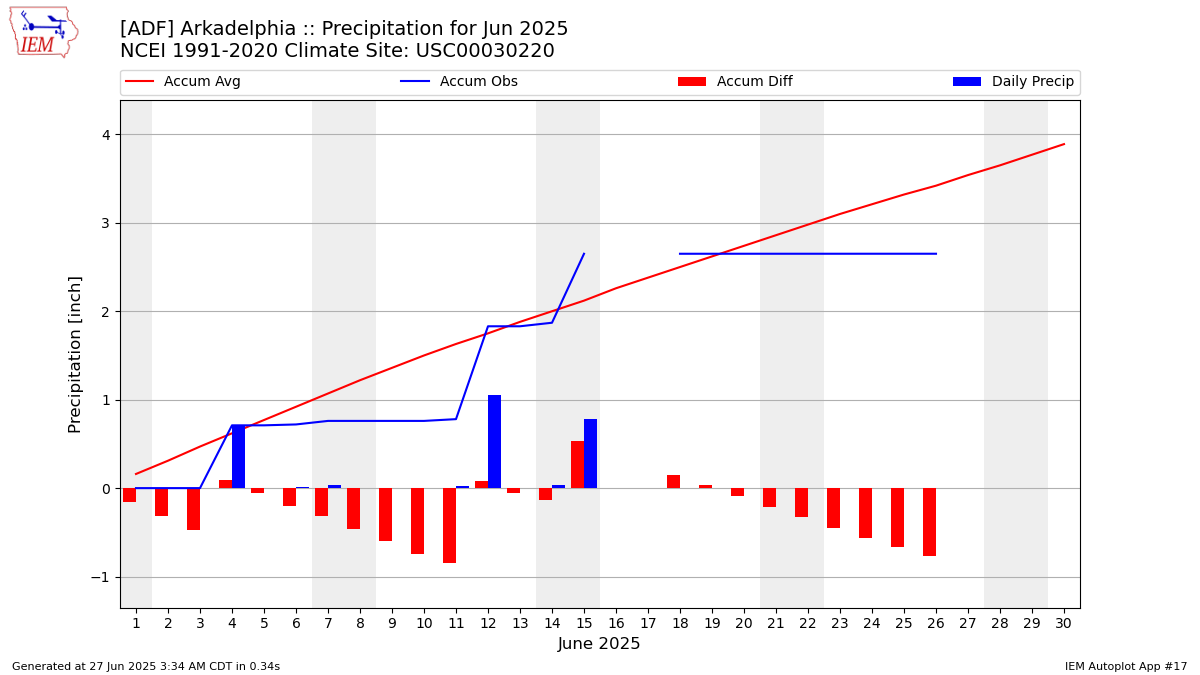
Description: This chart is of daily precipitation for the month. The red line would be an average month while the blue line and bars are observations.
Daily Average Wind Speeds
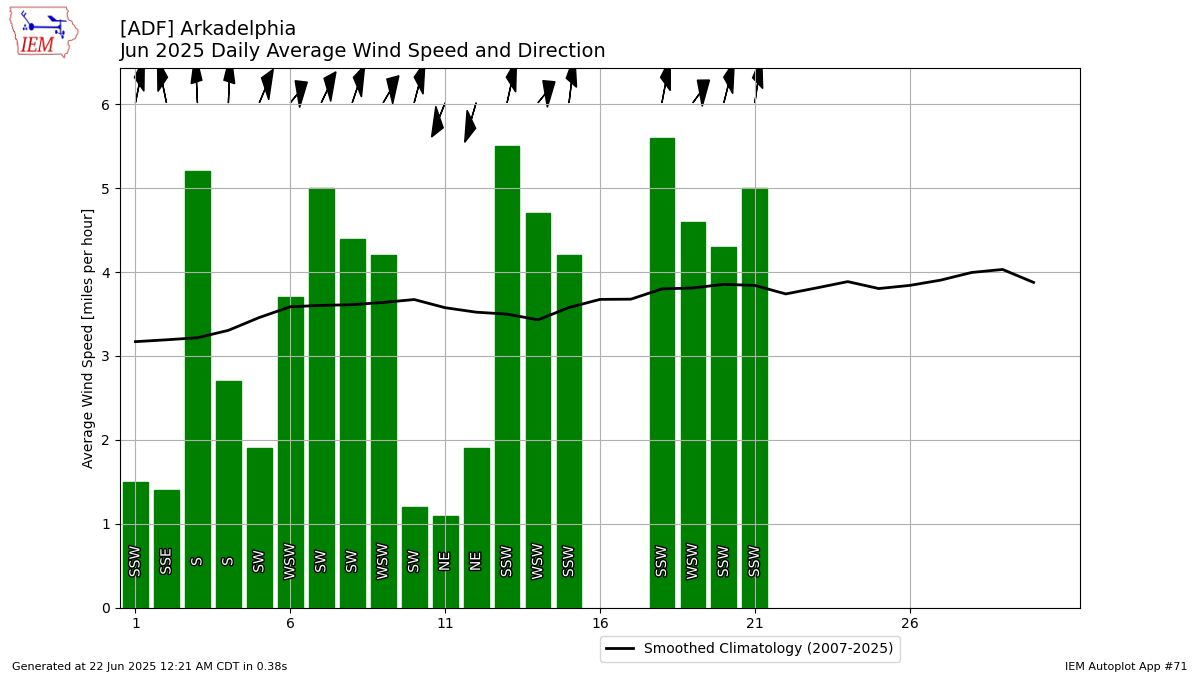
Description: This chart is of the daily average wind speeds.
The data presented here provided by IEM API webservice: daily.json. A simple CSV option exists as well.