| May 2025 | Jun 2025 | Jul 2025 | ||||
|---|---|---|---|---|---|---|
| Sunday | Monday | Tuesday | Wednesday | Thursday | Friday | Saturday |
| 01 High: 77.5292 Low: 58.130585 Precip: M Avg Wind: WSW @ 3.3 Gust: 30 (4:40 AM) RH% Min/Max: 58-97 Feel Min/Max: 58 to 78 | 02 High: 76.98922 Low: 65.949776 Precip: M Avg Wind: S @ 3.6 Gust: 22 (2:10 PM) RH% Min/Max: 60-87 Feel Min/Max: 66 to 77 | 03 High: 77.03059 Low: 63.23 Precip: M Avg Wind: S @ 5.1 Gust: 26 (4:30 PM) RH% Min/Max: 76-90 Feel Min/Max: 63 to 77 | 04 High: 73.799614 Low: 65.960594 Precip: M Avg Wind: S @ 3.9 Gust: 19 (9:40 AM) RH% Min/Max: 83-100 Feel Min/Max: 66 to 74 | 05 High: 79.9808 Low: 66.189224 Precip: M Avg Wind: SSW @ 2.5 Gust: 15 (4:30 PM) RH% Min/Max: 69-100 Feel Min/Max: 66 to 80 | 06 High: 77.37078 Low: 62.07979 Precip: M Avg Wind: WSW @ 4.2 Gust: 27 (9:15 AM) RH% Min/Max: 69-100 Feel Min/Max: 62 to 77 | 07 High: 77.48959 Low: 60.339222 Precip: M Avg Wind: SW @ 3.6 Gust: 24 (7:10 AM) RH% Min/Max: 67-100 Feel Min/Max: 60 to 77 |
| 08 High: 84.2792 Low: 66.079414 Precip: M Avg Wind: W @ 2.6 Gust: 16 (12:10 PM) RH% Min/Max: 39-87 Feel Min/Max: 66 to 87 | 09 High: 77.91081 Low: 63.94999 Precip: M Avg Wind: N @ 4.4 Gust: 22 (5:15 PM) RH% Min/Max: 32-94 Feel Min/Max: 64 to 78 | 10 High: 81.919395 Low: 62.290394 Precip: M Avg Wind: W @ 2.4 Gust: 14 (2:05 PM) RH% Min/Max: 34-75 Feel Min/Max: 62 to 82 | 11 High: 79.7792 Low: 64.36038 Precip: M Avg Wind: S @ 2.6 Gust: 16 (4:20 PM) RH% Min/Max: 60-92 Feel Min/Max: 64 to 80 | 12 High: 70.35079 Low: 63.190395 Precip: M Avg Wind: SSE @ 2.2 Gust: 14 (11:10 AM) RH% Min/Max: 75-99 Feel Min/Max: 63 to 70 | 13 High: 72.37942 Low: 64.27941 Precip: M Avg Wind: SSW @ 3.5 Gust: 15 (1:30 AM) RH% Min/Max: 86-100 Feel Min/Max: 64 to 72 | 14 High: 77.14941 Low: 65.26038 Precip: M Avg Wind: NNW @ 2.7 Gust: 22 (12:25 PM) RH% Min/Max: 73-99 Feel Min/Max: 65 to 77 |
| 15 High: 76.67963 Low: 64.529625 Precip: M Avg Wind: SSW @ 1.8 Gust: 22 (4:55 AM) RH% Min/Max: 65-96 Feel Min/Max: 65 to 77 | 16 High: 77.7002 Low: 65.66001 Precip: M Avg Wind: SSW @ 2.0 Gust: 8 (9:05 AM) RH% Min/Max: 79-100 Feel Min/Max: 66 to 78 | 17 High: 81.12019 Low: 68.63 Precip: M Avg Wind: WNW @ 2.8 Gust: 19 (1:20 PM) RH% Min/Max: 61-99 Feel Min/Max: 69 to 84 | 18 High: 80.40921 Low: 61.410225 Precip: M Avg Wind: SW @ 5.0 Gust: 30 (3:15 AM) RH% Min/Max: 56-100 Feel Min/Max: 61 to 82 | 19 High: 84.19999 Low: 69.5696 Precip: M Avg Wind: NNW @ 3.6 Gust: 21 (5:40 AM) RH% Min/Max: 41-93 Feel Min/Max: 70 to 85 | 20 High: 84.39082 Low: 67.71023 Precip: M Avg Wind: SSW @ 3.8 Gust: 20 (5:40 PM) RH% Min/Max: 66-97 Feel Min/Max: 68 to 91 | 21 High: 83.37019 Low: 71.31023 Precip: M Avg Wind: S @ 6.1 Gust: 25 (2:30 PM) RH% Min/Max: 63-95 Feel Min/Max: 71 to 88 |
| 22 High: 83.03 Low: 69.130424 Precip: M Avg Wind: S @ 4.4 Gust: 23 (10:20 AM) RH% Min/Max: 59-98 Feel Min/Max: 69 to 86 | 23 High: 83.420616 Low: 70.86022 Precip: M Avg Wind: S @ 3.7 Gust: 22 (9:45 AM) RH% Min/Max: 65-98 Feel Min/Max: 71 to 88 | 24 High: 85.47979 Low: 70.16001 Precip: M Avg Wind: S @ 2.2 Gust: 12 (10:20 AM) RH% Min/Max: 58-99 Feel Min/Max: 70 to 91 | 25 High: 84.01998 Low: 70.16001 Precip: M Avg Wind: S @ 2.5 Gust: 14 (11:40 AM) RH% Min/Max: 64-99 Feel Min/Max: 70 to 89 | 26 High: 81.96982 Low: 69.479576 Precip: M Avg Wind: S @ 3.7 Gust: 19 (1:15 PM) RH% Min/Max: 63-95 Feel Min/Max: 69 to 86 | 27 High: 79.86918 Low: 68.7308 Precip: M Avg Wind: SSW @ 3.0 Gust: 18 (12:30 PM) RH% Min/Max: 67-99 Feel Min/Max: 69 to 80 | 28 High: 81.750206 Low: 67.47979 Precip: M Avg Wind: SSW @ 3.0 Gust: 18 (7:05 PM) RH% Min/Max: 70-100 Feel Min/Max: 67 to 87 |
| 29 High: 84.180214 Low: 64.020195 Precip: M Avg Wind: SSW @ 4.0 Gust: 38 (6:55 PM) RH% Min/Max: 66-100 Feel Min/Max: 64 to 92 | 30 High: 79.26081 Low: 65.28021 Precip: M Avg Wind: SW @ 3.5 Gust: 16 (9:55 AM) RH% Min/Max: 72-95 Feel Min/Max: 65 to 79 | 01 | 02 | 03 | 04 | 05 |
The data presented here provided by IEM API webservice: daily.json. A simple CSV option exists as well.
Daily High/Low Plot
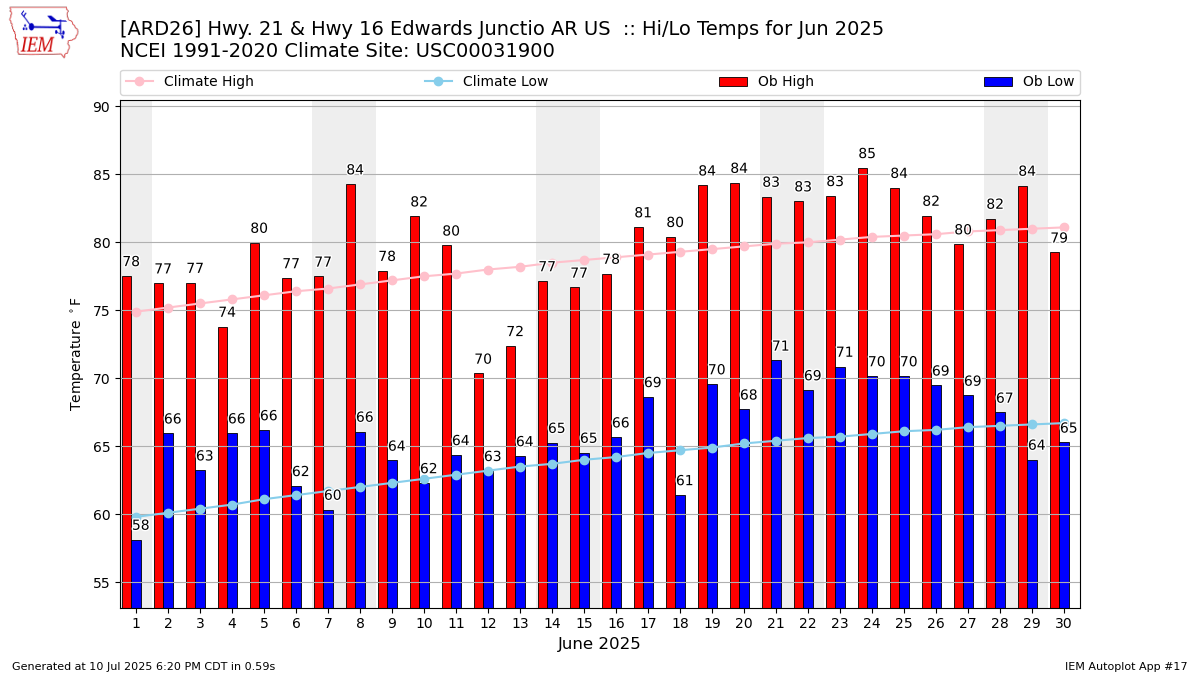
Description: This chart of the monthly temperature data. The bars are the observations and the dots are climatology.
Daily Rainfall
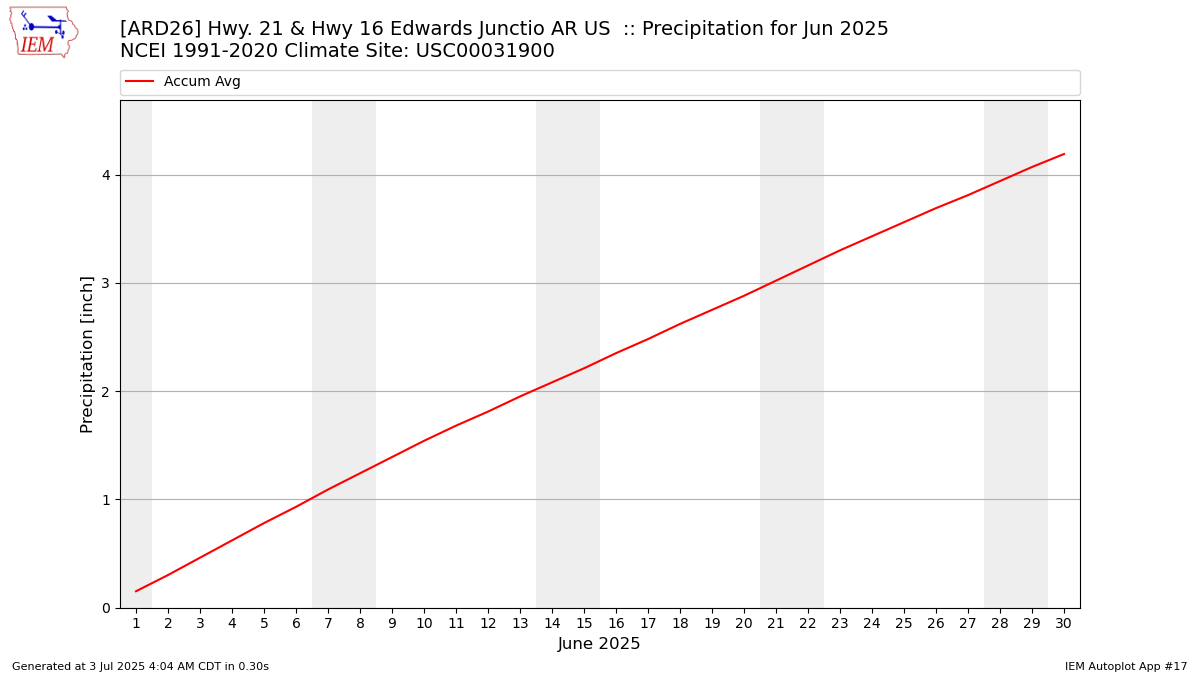
Description: This chart is of daily precipitation for the month. The red line would be an average month while the blue line and bars are observations.
Daily Average Wind Speeds
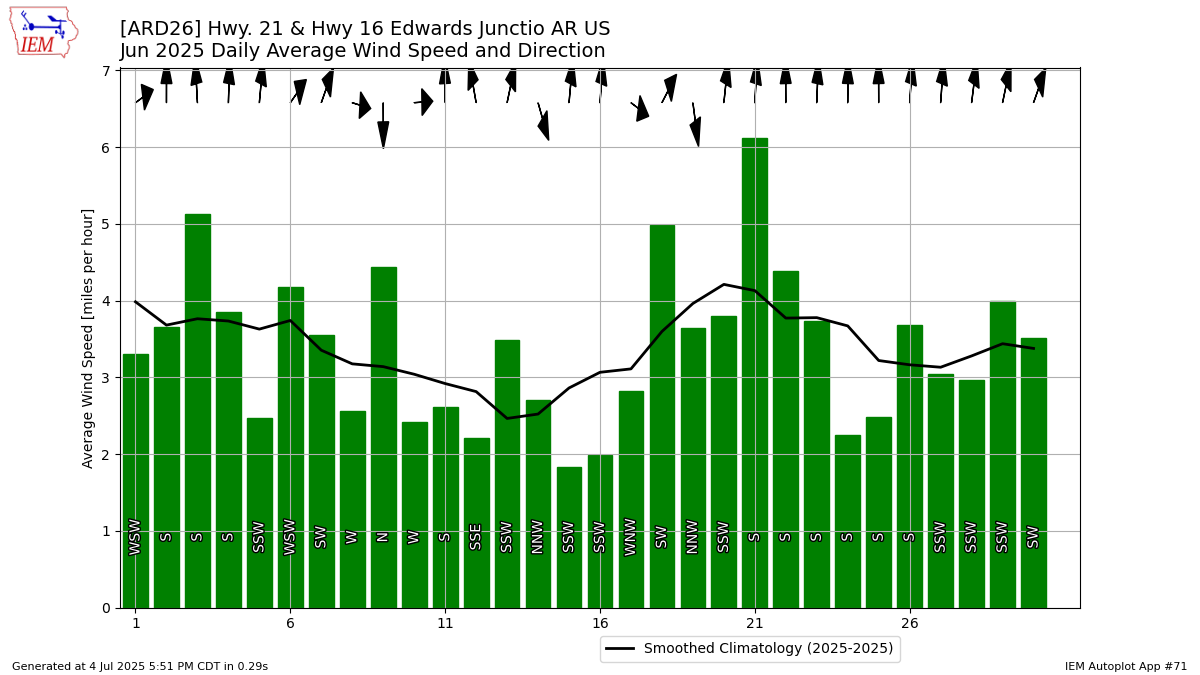
Description: This chart is of the daily average wind speeds.
The data presented here provided by IEM API webservice: daily.json. A simple CSV option exists as well.