| May 2025 | Jun 2025 | Jul 2025 | ||||
|---|---|---|---|---|---|---|
| Sunday | Monday | Tuesday | Wednesday | Thursday | Friday | Saturday |
| 01 High: 738.14 Low: 44.6 Precip: M Snow Depth: 21.65 | 02 High: 467.42 Low: 47.84 Precip: M Snow Depth: 20.08 | 03 High: 342.14 Low: 55.22 Precip: 0.02 Snow Depth: 19.29 | 04 High: 387.5 Low: 42.8 Precip: M Snow Depth: 18.5 | 05 High: 515.84 Low: 66.56 Precip: M Snow Depth: 15.75 | 06 High: 462.56 Low: 82.76 Precip: M Snow Depth: 12.6 | 07 High: 314.42 Low: 61.16 Precip: M Snow Depth: 9.45 |
| 08 High: 511.7 Low: 65.84 Precip: M Snow Depth: 4.33 | 09 High: 361.76 Low: 63.86 Precip: M Snow Depth: 0 | 10 High: 333.32 Low: 47.66 Precip: M Snow Depth: 0 | 11 High: 433.22 Low: 75.74 Precip: 0.36 Snow Depth: 0 | 12 High: 374.54 Low: 111.74 Precip: 0.18 Snow Depth: 0 | 13 High: 310.82 Low: 75.56 Precip: 0.30 Snow Depth: 0 | 14 High: 273.02 Low: 88.52 Precip: 0.07 Snow Depth: 0 |
| 15 High: 315.32 Low: 66.56 Precip: M Snow Depth: 0 | 16 High: 245.84 Low: 46.58 Precip: M Snow Depth: 0 | 17 High: 62.24 Low: 41.9 Precip: M Snow Depth: 0 | 18 High: 57.56 Low: 39.02 Precip: 0.17 Snow Depth: 0 | 19 High: 56.48 Low: 33.98 Precip: 0.05 Snow Depth: 0 | 20 High: 49.64 Low: 35.42 Precip: 0.33 Snow Depth: 0 | 21 High: 36.14 Low: 32.54 Precip: 0.84 Snow Depth: 0 |
| 22 High: 44.6 Low: 29.84 Precip: 0.01 Snow Depth: 0 | 23 High: 46.94 Low: 33.08 Precip: 0.04 Snow Depth: 0 | 24 High: 55.04 Low: 37.58 Precip: 0.02 Snow Depth: 0 | 25 High: 49.64 Low: 39.38 Precip: 0.46 Snow Depth: 0 | 26 High: 53.42 Low: 37.22 Precip: 0.18 Snow Depth: 0 | 27 High: 48.2 Low: 40.46 Precip: 0.36 Snow Depth: 124.8 | 28 High: 50.54 Low: 39.2 Precip: 0.10 Snow Depth: 84.25 |
| 29 High: 59.9 Low: 36.86 Precip: M Snow Depth: 0 | 30 High: 57.92 Low: 39.56 Precip: M Snow Depth: 0 | 01 | 02 | 03 | 04 | 05 |
The data presented here provided by IEM API webservice: daily.json. A simple CSV option exists as well.
Daily High/Low Plot
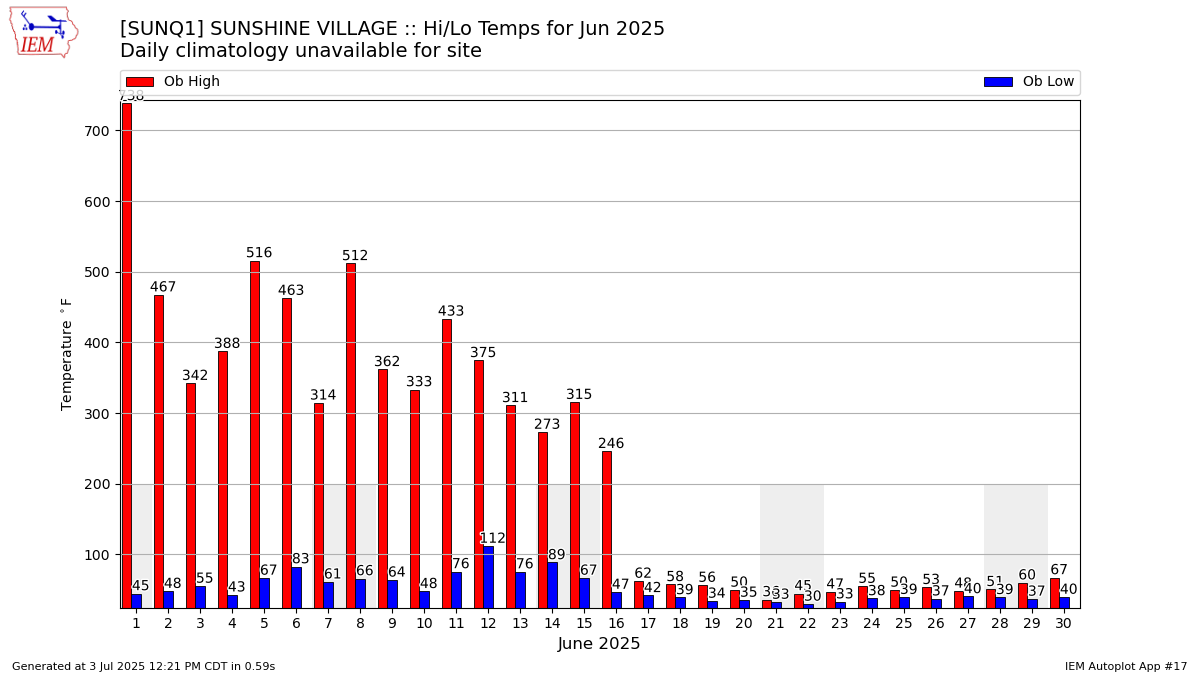
Description: This chart of the monthly temperature data. The bars are the observations and the dots are climatology.
Daily Rainfall
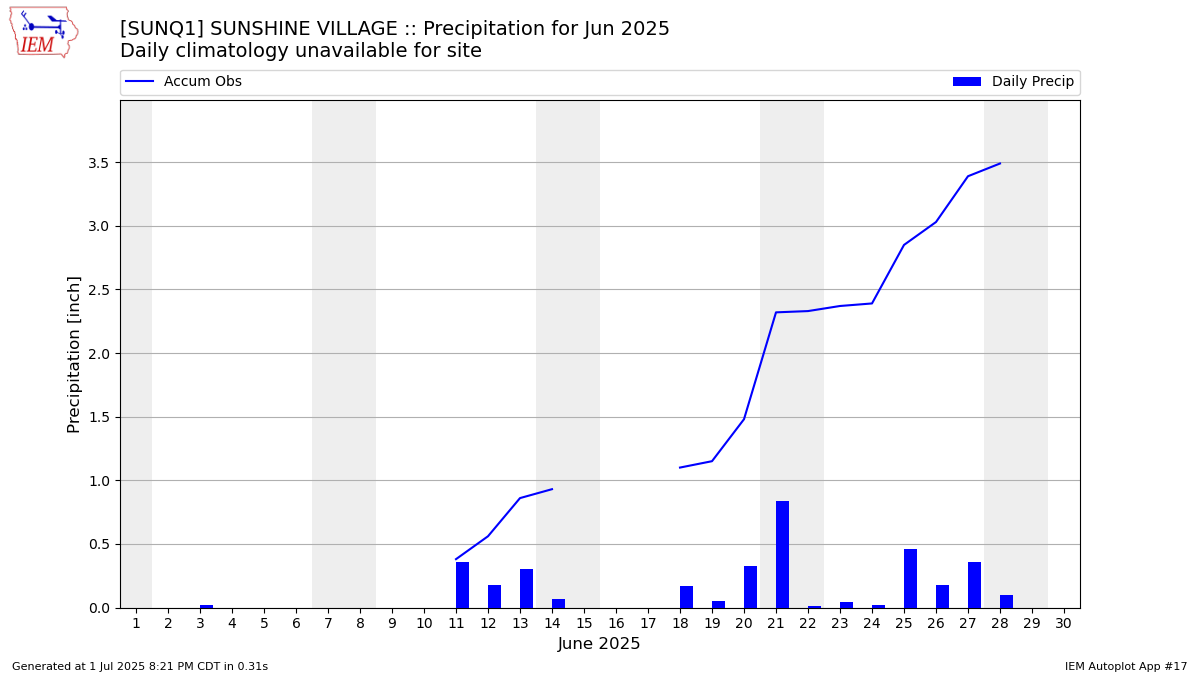
Description: This chart is of daily precipitation for the month. The red line would be an average month while the blue line and bars are observations.
Daily Average Wind Speeds

Description: This chart is of the daily average wind speeds.
The data presented here provided by IEM API webservice: daily.json. A simple CSV option exists as well.