| May 2025 | Jun 2025 | Jul 2025 | ||||
|---|---|---|---|---|---|---|
| Sunday | Monday | Tuesday | Wednesday | Thursday | Friday | Saturday |
| 01 High: 73 Low: 61 Precip: M Gust: WNW @ 116 (8:10 PM) RH% Min/Max: -99-64 Feel Min/Max: 61 to 73 | 02 High: 77 Low: 57 Precip: M Gust: WNW @ 148 (8:10 PM) RH% Min/Max: 20-64 Feel Min/Max: 57 to 77 | 03 High: 76 Low: 59 Precip: M Gust: WNW @ 139 (8:10 PM) RH% Min/Max: -99-65 Feel Min/Max: 59 to 76 | 04 High: 75 Low: 60 Precip: M Gust: WNW @ 138 (8:10 PM) RH% Min/Max: -99--99 Feel Min/Max: 60 to 75 | 05 High: 75 Low: 60 Precip: M Gust: WNW @ 137 (8:10 PM) RH% Min/Max: -99--99 Feel Min/Max: 60 to 75 | 06 High: 75 Low: 57 Precip: M Gust: WNW @ 130 (8:10 PM) RH% Min/Max: -99--99 Feel Min/Max: 57 to 75 | 07 High: 76 Low: 63 Precip: M Gust: WNW @ 147 (8:10 PM) RH% Min/Max: -99--99 Feel Min/Max: 63 to 76 |
| 08 High: 79 Low: 65 Precip: M Gust: WNW @ 162 (8:10 PM) RH% Min/Max: -99--99 Feel Min/Max: 65 to 79 | 09 High: 81 Low: 69 Precip: M Gust: WNW @ 141 (8:10 PM) RH% Min/Max: -99--99 Feel Min/Max: 62 to 79 | 10 High: 79 Low: 60 Precip: M Gust: WNW @ 169 (8:10 PM) RH% Min/Max: -99--99 Feel Min/Max: 60 to 79 | 11 High: 73 Low: 59 Precip: M Gust: WNW @ 166 (8:10 PM) RH% Min/Max: -99--99 Feel Min/Max: 59 to 73 | 12 High: 73 Low: 55 Precip: M Gust: WNW @ 164 (8:10 PM) RH% Min/Max: -99--99 Feel Min/Max: 55 to 73 | 13 High: 66 Low: 53 Precip: M Gust: WNW @ 177 (8:10 PM) RH% Min/Max: -99--99 Feel Min/Max: 53 to 66 | 14 High: 69 Low: 53 Precip: 0.00 Gust: WNW @ 144 (8:10 PM) RH% Min/Max: -99--99 Feel Min/Max: 54 to 69 |
| 15 High: 61 Low: 53 Precip: M Gust: WNW @ 109 (7:10 AM) RH% Min/Max: -99--99 Feel Min/Max: 53 to 61 | 16 Precip: M | 17 High: 73 Low: 54 Precip: M Gust: WNW @ 167 (8:10 PM) RH% Min/Max: -99--99 Feel Min/Max: 54 to 73 | 18 High: 79 Low: 65 Precip: M Gust: WNW @ 174 (8:10 PM) RH% Min/Max: -99--99 Feel Min/Max: 65 to 79 | 19 High: 71 Low: 53 Precip: 0.00 Gust: WNW @ 169 (8:10 PM) RH% Min/Max: -99--99 Feel Min/Max: 53 to 71 | 20 High: 58 Low: 39 Precip: M Gust: WNW @ 174 (8:10 PM) RH% Min/Max: -99--99 Feel Min/Max: 30 to 58 | 21 High: 59 Low: 34 Precip: M Gust: WNW @ 159 (8:10 PM) RH% Min/Max: -99--99 Feel Min/Max: 25 to 59 |
| 22 High: 65 Low: 44 Precip: M Gust: WNW @ 155 (8:10 PM) RH% Min/Max: -99--99 Feel Min/Max: 39 to 65 | 23 High: 71 Low: 55 Precip: M Gust: WNW @ 117 (7:10 AM) RH% Min/Max: -99--99 Feel Min/Max: 55 to 71 | 24 High: 75 Low: 55 Precip: M Gust: WNW @ 171 (8:10 PM) RH% Min/Max: -99--99 Feel Min/Max: 55 to 75 | 25 High: 74 Low: 59 Precip: M Gust: WNW @ 164 (8:10 PM) RH% Min/Max: -99--99 Feel Min/Max: 59 to 74 | 26 High: 73 Low: 59 Precip: M Gust: WNW @ 167 (8:10 PM) RH% Min/Max: -99--99 Feel Min/Max: 59 to 73 | 27 High: 78 Low: 64 Precip: M Gust: WNW @ 169 (8:10 PM) RH% Min/Max: -99--99 Feel Min/Max: 64 to 78 | 28 Precip: M |
| 29 Precip: M | 30 | 01 | 02 | 03 | 04 | 05 |
The data presented here provided by IEM API webservice: daily.json. A simple CSV option exists as well.
Daily High/Low Plot
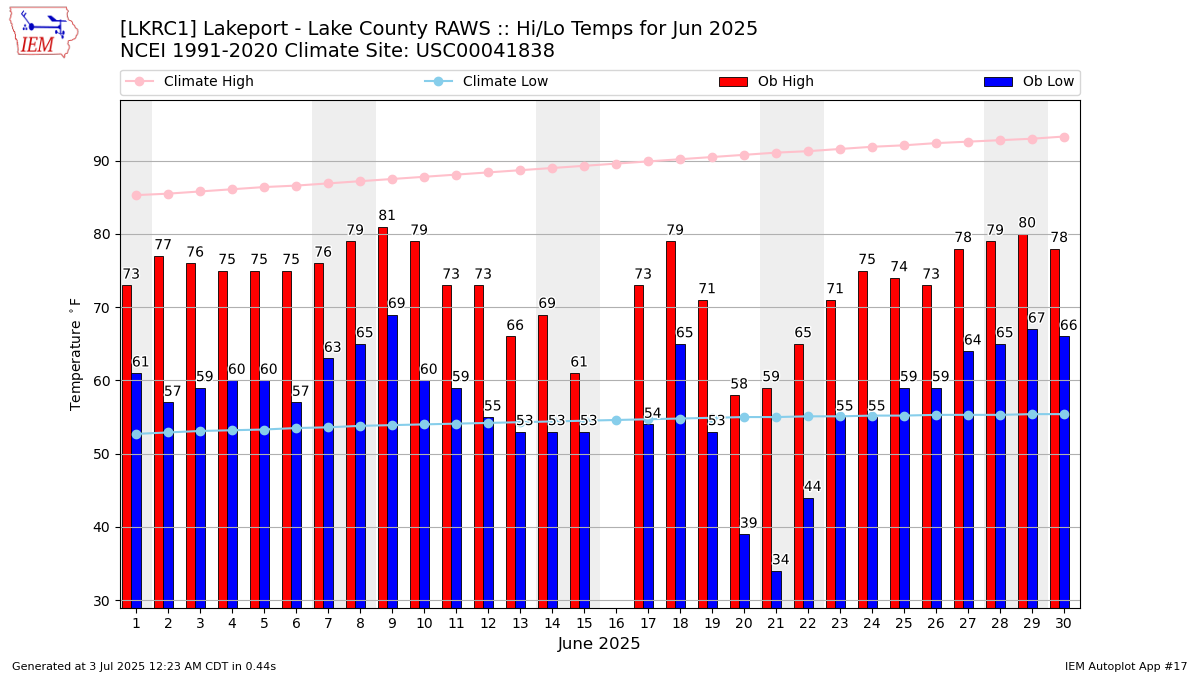
Description: This chart of the monthly temperature data. The bars are the observations and the dots are climatology.
Daily Rainfall
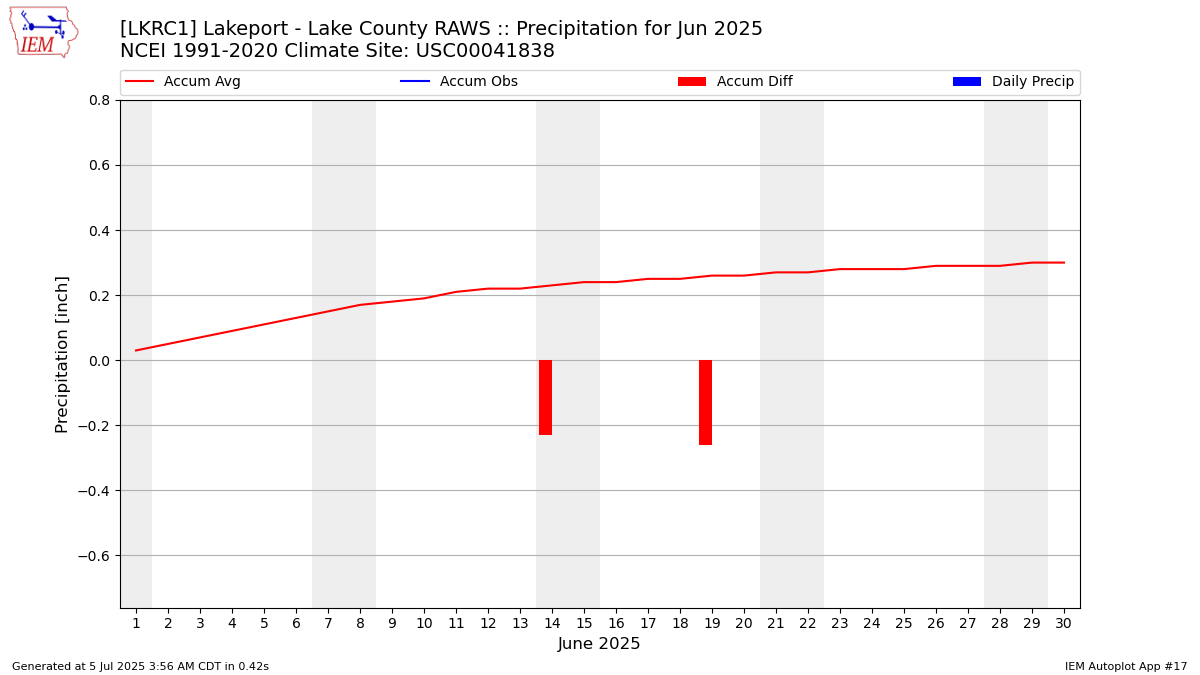
Description: This chart is of daily precipitation for the month. The red line would be an average month while the blue line and bars are observations.
Daily Average Wind Speeds
Description: This chart is of the daily average wind speeds.
The data presented here provided by IEM API webservice: daily.json. A simple CSV option exists as well.