| May 2025 | Jun 2025 | Jul 2025 | ||||
|---|---|---|---|---|---|---|
| Sunday | Monday | Tuesday | Wednesday | Thursday | Friday | Saturday |
| 01 High: 65.13981 Low: 48.680588 Precip: M Avg Wind: W @ 3.7 RH% Min/Max: 47-100 Feel Min/Max: 47 to 65 | 02 High: 72.89061 Low: 46.41982 Precip: M Avg Wind: WSW @ 2.6 RH% Min/Max: 38-100 Feel Min/Max: 46 to 73 | 03 High: 81.76998 Low: 47.069607 Precip: M Avg Wind: SW @ 2.6 RH% Min/Max: 26-100 Feel Min/Max: 47 to 80 | 04 High: 83.46023 Low: 59.640823 Precip: M Avg Wind: SW @ 4.4 RH% Min/Max: 45-76 Feel Min/Max: 60 to 84 | 05 High: 92.71939 Low: 62.589222 Precip: M Avg Wind: SW @ 3.3 RH% Min/Max: 46-97 Feel Min/Max: 63 to 102 | 06 High: 87.499405 Low: 67.98922 Precip: M Avg Wind: SSW @ 3.1 RH% Min/Max: 60-100 Feel Min/Max: 68 to 95 | 07 High: 74.960594 Low: 62.479416 Precip: M Avg Wind: WSW @ 1.1 RH% Min/Max: 86-100 Feel Min/Max: 62 to 75 |
| 08 High: 77.12963 Low: 60.009796 Precip: M Avg Wind: ESE @ 2.3 RH% Min/Max: 62-100 Feel Min/Max: 60 to 77 | 09 High: 73.58 Low: 59.46982 Precip: M Avg Wind: E @ 2.9 RH% Min/Max: 72-100 Feel Min/Max: 59 to 74 | 10 High: 69.92963 Low: 60.560596 Precip: M Avg Wind: SSW @ 1.5 RH% Min/Max: 96-100 Feel Min/Max: 61 to 70 | 11 High: 82.0994 Low: 59.259212 Precip: M Avg Wind: WSW @ 4.3 RH% Min/Max: 45-100 Feel Min/Max: 59 to 82 | 12 High: 88.17979 Low: 67.64002 Precip: M Avg Wind: W @ 3.7 RH% Min/Max: 38-73 Feel Min/Max: 68 to 88 | 13 High: 81.42979 Low: 59.46982 Precip: M Avg Wind: SW @ 2.1 RH% Min/Max: 40-79 Feel Min/Max: 59 to 81 | 14 High: 63.690823 Low: 58.319607 Precip: M Avg Wind: E @ 2.4 RH% Min/Max: 64-100 Feel Min/Max: 58 to 64 |
| 15 High: 71.16081 Low: 57.54919 Precip: M Avg Wind: ESE @ 1.7 RH% Min/Max: 63-84 Feel Min/Max: 58 to 71 | 16 High: 78.380585 Low: 55.239807 Precip: M Avg Wind: S @ 2.5 RH% Min/Max: 43-100 Feel Min/Max: 55 to 78 | 17 High: 69.330215 Low: 61.120407 Precip: M Avg Wind: SSW @ 1.7 RH% Min/Max: 84-100 Feel Min/Max: 61 to 69 | 18 High: 79.570404 Low: 64.05079 Precip: M Avg Wind: SSW @ 2.5 RH% Min/Max: 80-100 Feel Min/Max: 64 to 80 | 19 High: 90.48022 Low: 68.5292 Precip: M Avg Wind: SW @ 5.0 RH% Min/Max: 59-100 Feel Min/Max: 69 to 103 | 20 High: 83.269394 Low: 67.69039 Precip: M Avg Wind: W @ 3.9 RH% Min/Max: 44-93 Feel Min/Max: 68 to 84 | 21 High: 88.17979 Low: 61.309425 Precip: M Avg Wind: SW @ 2.4 RH% Min/Max: 43-95 Feel Min/Max: 61 to 91 |
| 22 High: 93.759796 Low: 70.64061 Precip: M Avg Wind: WSW @ 3.8 RH% Min/Max: 48-100 Feel Min/Max: 71 to 106 | 23 High: 98.02941 Low: 72.37041 Precip: M Avg Wind: SW @ 2.6 RH% Min/Max: 55-100 Feel Min/Max: 72 to 121 | 24 High: 100.25958 Low: 74.76081 Precip: M Avg Wind: W @ 1.6 RH% Min/Max: 40-100 Feel Min/Max: 75 to 114 | 25 High: 97.17078 Low: 74.62041 Precip: M Avg Wind: NW @ 1.2 RH% Min/Max: 44-94 Feel Min/Max: 75 to 109 | 26 High: 79.14919 Low: 60.009796 Precip: M Avg Wind: E @ 2.1 RH% Min/Max: 51-100 Feel Min/Max: 60 to 79 | 27 High: 73.74919 Low: 61.120407 Precip: M Avg Wind: S @ 2.9 RH% Min/Max: 50-100 Feel Min/Max: 61 to 74 | 28 High: 66.0308 Low: 60.74061 Precip: M RH% Min/Max: 59-100 Feel Min/Max: 61 to 66 |
| 29 Precip: M | 30 | 01 | 02 | 03 | 04 | 05 |
The data presented here provided by IEM API webservice: daily.json. A simple CSV option exists as well.
Daily High/Low Plot
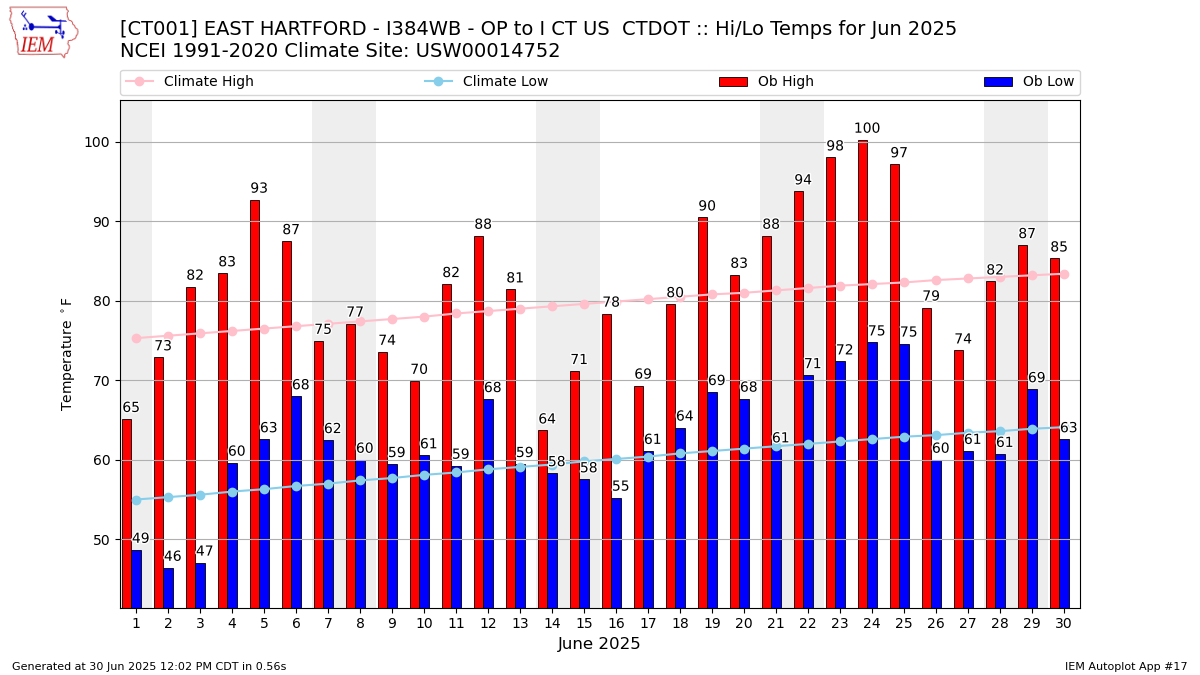
Description: This chart of the monthly temperature data. The bars are the observations and the dots are climatology.
Daily Rainfall
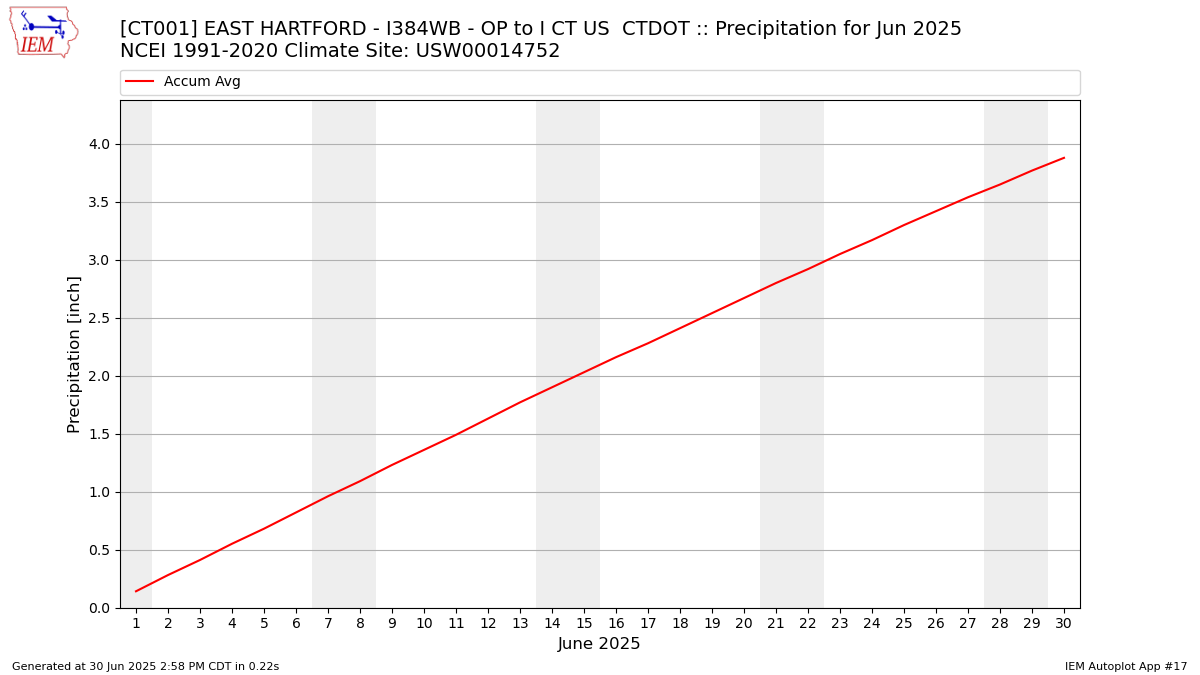
Description: This chart is of daily precipitation for the month. The red line would be an average month while the blue line and bars are observations.
Daily Average Wind Speeds
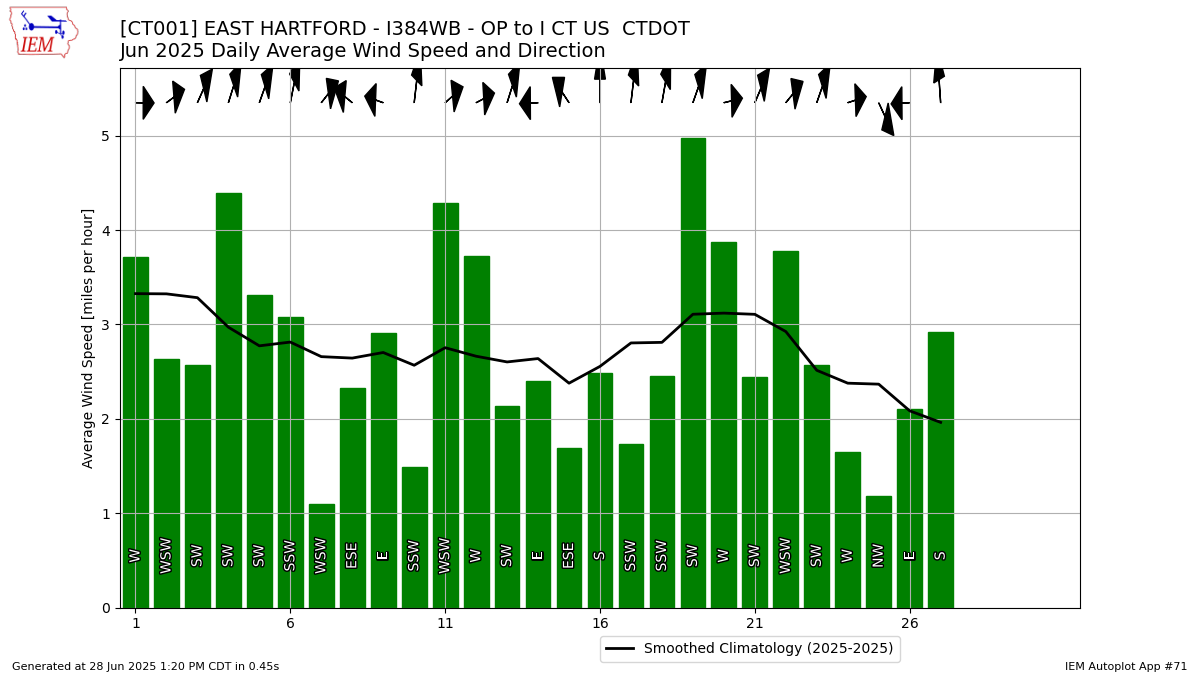
Description: This chart is of the daily average wind speeds.
The data presented here provided by IEM API webservice: daily.json. A simple CSV option exists as well.