| May 2025 | Jun 2025 | Jul 2025 | ||||
|---|---|---|---|---|---|---|
| Sunday | Monday | Tuesday | Wednesday | Thursday | Friday | Saturday |
| 01 High: 64.04002 Low: 47.66001 Precip: M Avg Wind: SW @ 1.2 RH% Min/Max: 48-94 Feel Min/Max: 48 to 64 | 02 High: 73.180374 Low: 44.439808 Precip: M Avg Wind: WSW @ 1.0 RH% Min/Max: 40-97 Feel Min/Max: 44 to 73 | 03 High: 81.750206 Low: 43.21939 Precip: M Avg Wind: WNW @ 0.9 RH% Min/Max: 28-97 Feel Min/Max: 43 to 80 | 04 High: 88.69999 Low: 49.22062 Precip: M Avg Wind: ESE @ 1.0 RH% Min/Max: 42-97 Feel Min/Max: 49 to 90 | 05 High: 94.85058 Low: 57.790394 Precip: M Avg Wind: WNW @ 0.7 RH% Min/Max: 36-97 Feel Min/Max: 58 to 99 | 06 High: 88.37062 Low: 65.39002 Precip: M Avg Wind: W @ 0.8 RH% Min/Max: 52-98 Feel Min/Max: 65 to 94 | 07 High: 71.6792 Low: 63.1292 Precip: M Avg Wind: WNW @ 0.6 RH% Min/Max: 94-100 Feel Min/Max: 63 to 72 |
| 08 High: 78.4598 Low: 60.940395 Precip: M Avg Wind: ESE @ 1.2 RH% Min/Max: 56-100 Feel Min/Max: 61 to 78 | 09 High: 68.86939 Low: 59.28981 Precip: M Avg Wind: ESE @ 0.9 RH% Min/Max: 76-99 Feel Min/Max: 59 to 69 | 10 High: 74.17941 Low: 62.470406 Precip: M Avg Wind: N @ 0.7 RH% Min/Max: 84-99 Feel Min/Max: 62 to 74 | 11 High: 81.68 Low: 58.6994 Precip: M Avg Wind: NNW @ 0.9 RH% Min/Max: 49-99 Feel Min/Max: 59 to 83 | 12 High: 88.21038 Low: 56.82019 Precip: M Avg Wind: WSW @ 0.9 RH% Min/Max: 38-98 Feel Min/Max: 57 to 90 | 13 High: 80.1896 Low: 55.86081 Precip: M Avg Wind: WSW @ 0.9 RH% Min/Max: 35-90 Feel Min/Max: 56 to 80 | 14 High: 65.87963 Low: 58.609425 Precip: M Avg Wind: N @ 1.3 RH% Min/Max: 74-97 Feel Min/Max: 59 to 66 |
| 15 High: 68.86038 Low: 58.49962 Precip: M Avg Wind: NE @ 0.7 RH% Min/Max: 71-96 Feel Min/Max: 58 to 69 | 16 High: 76.22062 Low: 55.360382 Precip: M Avg Wind: NE @ 1.0 RH% Min/Max: 51-97 Feel Min/Max: 55 to 76 | 17 High: 67.28 Low: 59.259212 Precip: M Avg Wind: ESE @ 0.6 RH% Min/Max: 97-99 Feel Min/Max: 59 to 67 | 18 High: 78.15921 Low: 64.70058 Precip: M Avg Wind: ENE @ 0.6 RH% Min/Max: 83-99 Feel Min/Max: 65 to 78 | 19 High: 91.0598 Low: 70.680214 Precip: M Avg Wind: ESE @ 1.0 RH% Min/Max: 57-99 Feel Min/Max: 71 to 103 | 20 High: 82.70959 Low: 62.850204 Precip: M Avg Wind: WSW @ 1.5 RH% Min/Max: 42-92 Feel Min/Max: 63 to 83 | 21 High: 86.57062 Low: 58.040607 Precip: M Avg Wind: NW @ 0.9 RH% Min/Max: 49-97 Feel Min/Max: 58 to 90 |
| 22 High: 89.2904 Low: 68.050415 Precip: M Avg Wind: WSW @ 0.9 RH% Min/Max: 65-99 Feel Min/Max: 68 to 101 | 23 High: 96.069176 Low: 74.82019 Precip: M Avg Wind: WNW @ 0.7 RH% Min/Max: 55-98 Feel Min/Max: 75 to 118 | 24 High: 98.34978 Low: 71.90057 Precip: M Avg Wind: WSW @ 0.7 RH% Min/Max: 43-98 Feel Min/Max: 72 to 113 | 25 High: 94.940605 Low: 70.89983 Precip: M Avg Wind: W @ 0.9 RH% Min/Max: 47-98 Feel Min/Max: 71 to 105 | 26 High: 74.890396 Low: 60.400417 Precip: M Avg Wind: NNE @ 1.3 RH% Min/Max: 58-97 Feel Min/Max: 60 to 75 | 27 High: 74.910225 Low: 60.929573 Precip: M Avg Wind: ESE @ 1.1 RH% Min/Max: 47-93 Feel Min/Max: 61 to 75 | 28 High: 83.29999 Low: 60.549774 Precip: M Avg Wind: SE @ 0.8 RH% Min/Max: 59-97 Feel Min/Max: 61 to 90 |
| 29 High: 80.2994 Low: 68.07019 Precip: M RH% Min/Max: 64-97 Feel Min/Max: 68 to 83 | 30 Precip: M | 01 | 02 | 03 | 04 | 05 |
The data presented here provided by IEM API webservice: daily.json. A simple CSV option exists as well.
Daily High/Low Plot
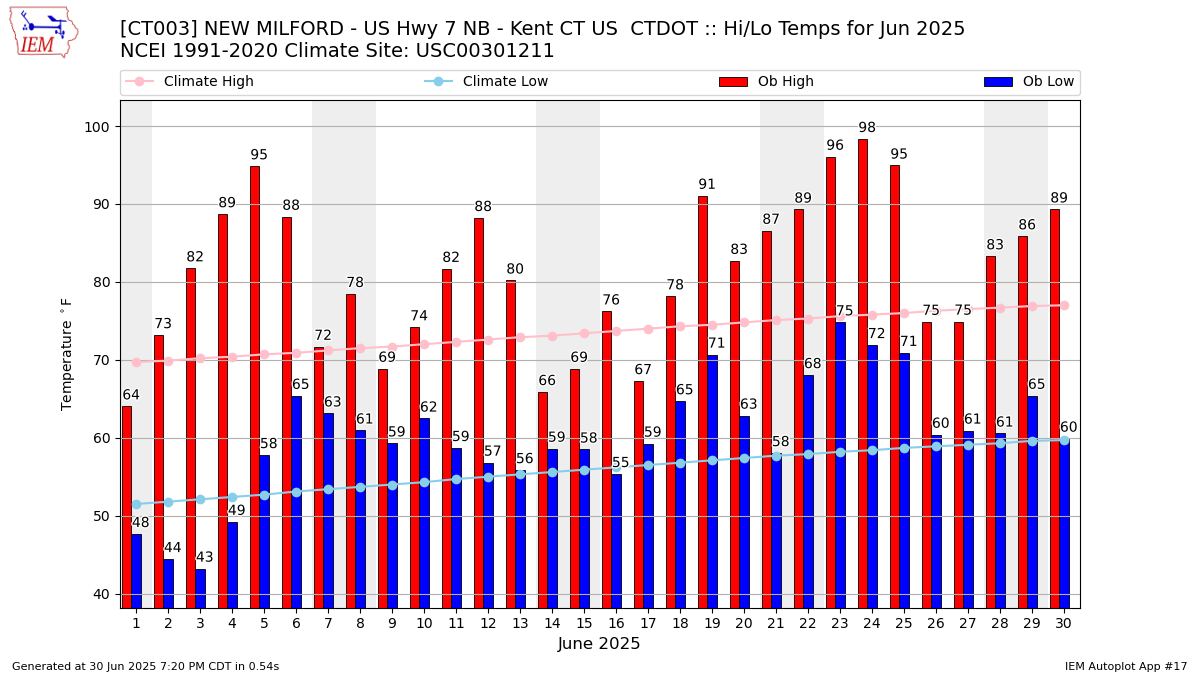
Description: This chart of the monthly temperature data. The bars are the observations and the dots are climatology.
Daily Rainfall
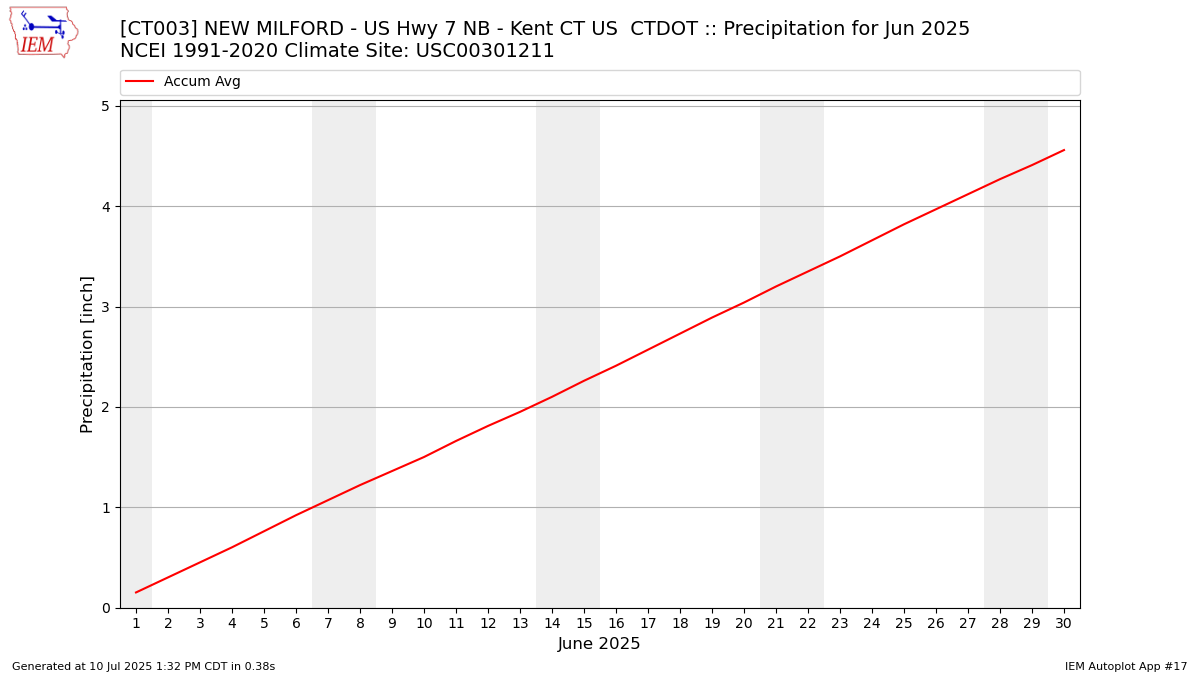
Description: This chart is of daily precipitation for the month. The red line would be an average month while the blue line and bars are observations.
Daily Average Wind Speeds
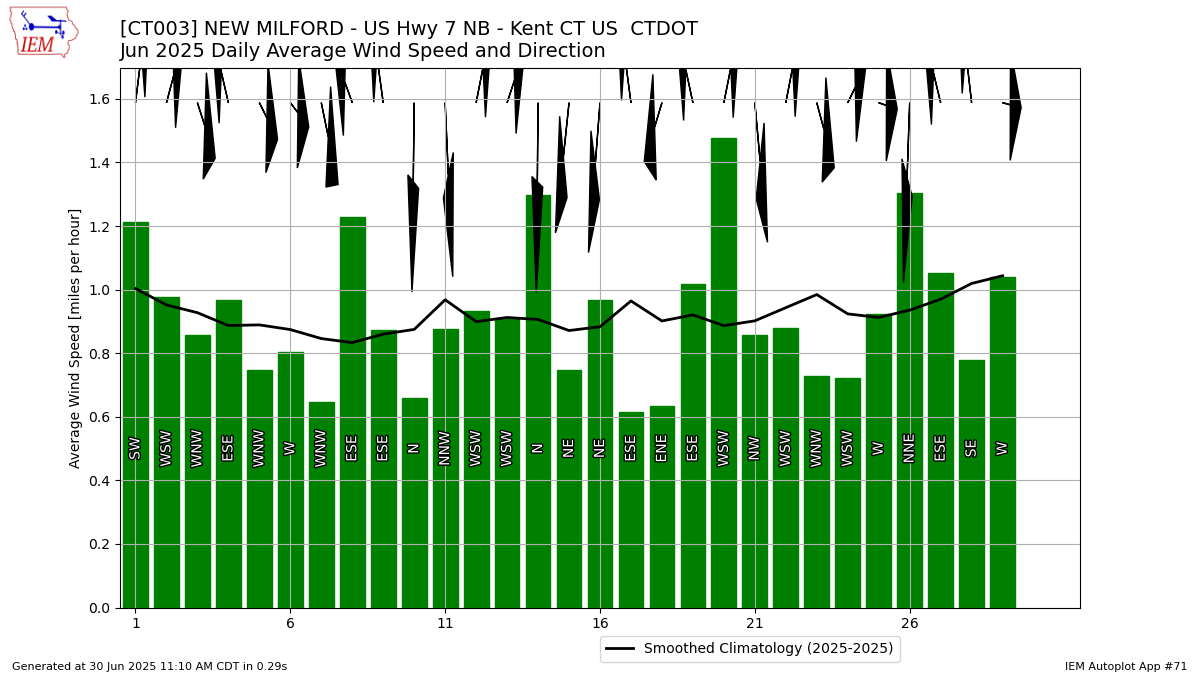
Description: This chart is of the daily average wind speeds.
The data presented here provided by IEM API webservice: daily.json. A simple CSV option exists as well.