| May 2025 | Jun 2025 | Jul 2025 | ||||
|---|---|---|---|---|---|---|
| Sunday | Monday | Tuesday | Wednesday | Thursday | Friday | Saturday |
| 01 High: 63.089596 Low: 46.94002 Precip: M Avg Wind: E @ 6.6 RH% Min/Max: 51-99 Feel Min/Max: 43 to 63 | 02 High: 71.24002 Low: 48.180214 Precip: M Avg Wind: E @ 3.3 RH% Min/Max: 45-100 Feel Min/Max: 48 to 71 | 03 High: 80.4002 Low: 47.01918 Precip: M Avg Wind: ENE @ 2.3 RH% Min/Max: 30-100 Feel Min/Max: 47 to 80 | 04 High: 79.14018 Low: 50.140396 Precip: M Avg Wind: ENE @ 2.6 RH% Min/Max: 49-98 Feel Min/Max: 50 to 79 | 05 High: 90.930214 Low: 57.709427 Precip: M Avg Wind: ENE @ 2.4 RH% Min/Max: 43-100 Feel Min/Max: 58 to 99 | 06 High: 85.029785 Low: 65.8292 Precip: M Avg Wind: ENE @ 2.7 RH% Min/Max: 66-100 Feel Min/Max: 66 to 91 | 07 High: 78.0404 Low: 65.33059 Precip: M Avg Wind: NE @ 1.6 RH% Min/Max: 79-100 Feel Min/Max: 65 to 78 |
| 08 High: 77.250206 Low: 62.020405 Precip: M Avg Wind: W @ 2.4 RH% Min/Max: 63-100 Feel Min/Max: 62 to 77 | 09 High: 71.07078 Low: 59.739807 Precip: M Avg Wind: W @ 2.7 RH% Min/Max: 74-100 Feel Min/Max: 60 to 71 | 10 High: 69.29061 Low: 64.58 Precip: M Avg Wind: NE @ 1.7 RH% Min/Max: 100-100 Feel Min/Max: 65 to 69 | 11 High: 79.59919 Low: 59.82979 Precip: M Avg Wind: ENE @ 3.2 RH% Min/Max: 54-100 Feel Min/Max: 60 to 80 | 12 High: 87.009796 Low: 58.319607 Precip: M Avg Wind: E @ 3.8 RH% Min/Max: 46-100 Feel Min/Max: 58 to 89 | 13 High: 77.5292 Low: 57.14061 Precip: M Avg Wind: NE @ 1.8 RH% Min/Max: 51-98 Feel Min/Max: 57 to 78 | 14 High: 61.66939 Low: 55.21998 Precip: M Avg Wind: WSW @ 1.7 RH% Min/Max: 93-100 Feel Min/Max: 55 to 62 |
| 15 High: 69.99082 Low: 55.819393 Precip: M Avg Wind: W @ 1.5 RH% Min/Max: 65-100 Feel Min/Max: 56 to 70 | 16 High: 75.880424 Low: 54.91939 Precip: M Avg Wind: WNW @ 2.4 RH% Min/Max: 48-100 Feel Min/Max: 55 to 76 | 17 High: 69.51022 Low: 61.860226 Precip: M Avg Wind: WNW @ 1.7 RH% Min/Max: 91-100 Feel Min/Max: 62 to 70 | 18 High: 79.939384 Low: 66.860596 Precip: M Avg Wind: ENE @ 1.7 RH% Min/Max: 82-100 Feel Min/Max: 67 to 80 | 19 High: 87.45079 Low: 69.20959 Precip: M Avg Wind: ENE @ 3.6 RH% Min/Max: 66-100 Feel Min/Max: 69 to 99 | 20 High: 81.62963 Low: 61.390396 Precip: M Avg Wind: E @ 8.2 RH% Min/Max: 48-97 Feel Min/Max: 61 to 82 | 21 High: 84.36918 Low: 56.569977 Precip: M Avg Wind: ENE @ 2.7 RH% Min/Max: 53-100 Feel Min/Max: 57 to 88 |
| 22 High: 92.74999 Low: 67.89018 Precip: M Avg Wind: E @ 4.4 RH% Min/Max: 57-100 Feel Min/Max: 68 to 106 | 23 High: 94.60042 Low: 70.5308 Precip: M Avg Wind: ENE @ 1.9 RH% Min/Max: 63-100 Feel Min/Max: 71 to 116 | 24 High: 98.76918 Low: 72.12019 Precip: M Avg Wind: E @ 2.5 RH% Min/Max: 44-100 Feel Min/Max: 72 to 112 | 25 High: 95.61918 Low: 70.89082 Precip: M Avg Wind: ESE @ 2.2 RH% Min/Max: 49-100 Feel Min/Max: 71 to 109 | 26 High: 75.189224 Low: 60.24018 Precip: M Avg Wind: WSW @ 2.0 RH% Min/Max: 75-100 Feel Min/Max: 60 to 75 | 27 High: 64.32078 Low: 60.54082 Precip: M RH% Min/Max: 78-96 Feel Min/Max: 61 to 64 | 28 Precip: M |
| 29 | 30 | 01 | 02 | 03 | 04 | 05 |
The data presented here provided by IEM API webservice: daily.json. A simple CSV option exists as well.
Daily High/Low Plot
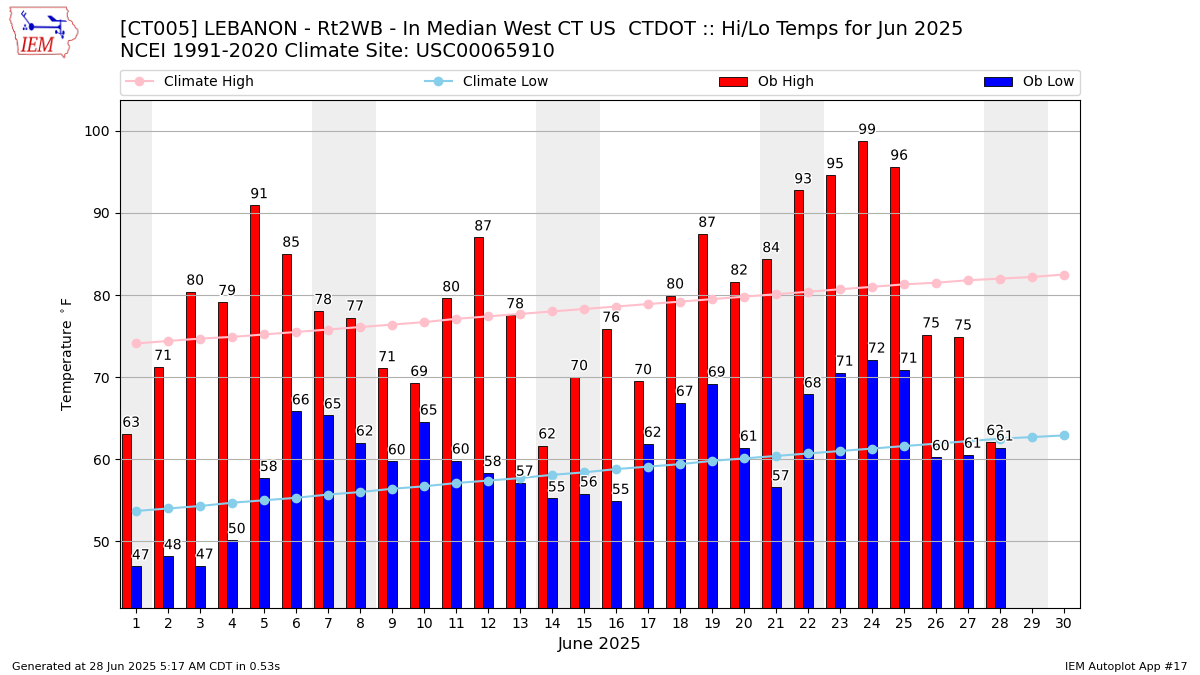
Description: This chart of the monthly temperature data. The bars are the observations and the dots are climatology.
Daily Rainfall
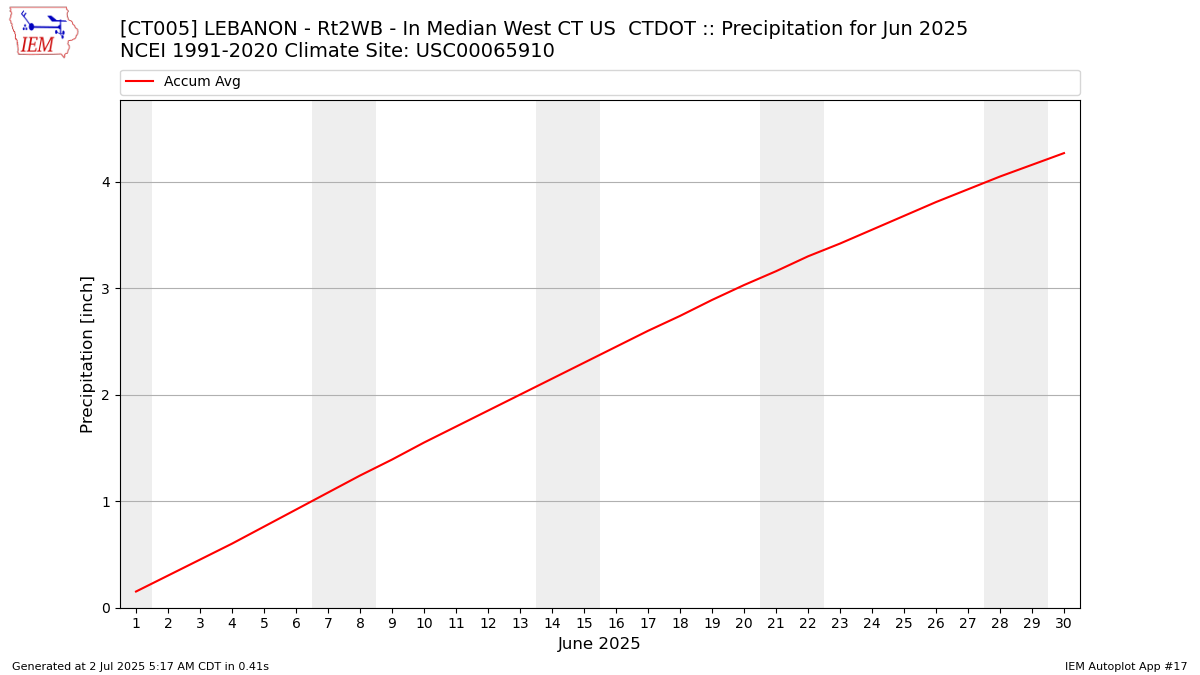
Description: This chart is of daily precipitation for the month. The red line would be an average month while the blue line and bars are observations.
Daily Average Wind Speeds

Description: This chart is of the daily average wind speeds.
The data presented here provided by IEM API webservice: daily.json. A simple CSV option exists as well.