| May 2025 | Jun 2025 | Jul 2025 | ||||
|---|---|---|---|---|---|---|
| Sunday | Monday | Tuesday | Wednesday | Thursday | Friday | Saturday |
| 01 High: 65.29999 Low: 49.429413 Precip: M Avg Wind: NW @ 4.3 RH% Min/Max: 43-89 Feel Min/Max: 48 to 65 | 02 High: 71.799774 Low: 48.529415 Precip: M Avg Wind: WNW @ 3.6 RH% Min/Max: 44-93 Feel Min/Max: 49 to 72 | 03 High: 79.75042 Low: 46.999405 Precip: M Avg Wind: WSW @ 2.8 RH% Min/Max: 28-96 Feel Min/Max: 47 to 80 | 04 High: 80.45959 Low: 51.589382 Precip: M Avg Wind: WSW @ 2.6 RH% Min/Max: 50-95 Feel Min/Max: 52 to 81 | 05 High: 88.53981 Low: 58.3808 Precip: M Avg Wind: W @ 3.2 RH% Min/Max: 52-97 Feel Min/Max: 58 to 93 | 06 High: 84.079414 Low: 66.25042 Precip: M Avg Wind: SSE @ 3.1 RH% Min/Max: 61-96 Feel Min/Max: 66 to 88 | 07 High: 75.7994 Low: 63.210224 Precip: M Avg Wind: SE @ 2.4 RH% Min/Max: 81-100 Feel Min/Max: 63 to 76 |
| 08 High: 73.889595 Low: 60.380585 Precip: M Avg Wind: ESE @ 4.9 RH% Min/Max: 67-100 Feel Min/Max: 60 to 74 | 09 High: 62.25079 Low: 59.860382 Precip: M Avg Wind: ESE @ 8.9 RH% Min/Max: 87-100 Feel Min/Max: 60 to 62 | 10 High: 70.06998 Low: 59.99002 Precip: M Avg Wind: ESE @ 3.7 RH% Min/Max: 84-100 Feel Min/Max: 60 to 70 | 11 High: 82.529625 Low: 57.99919 Precip: M Avg Wind: W @ 3.1 RH% Min/Max: 44-100 Feel Min/Max: 58 to 83 | 12 High: 88.62978 Low: 59.320404 Precip: M Avg Wind: NW @ 3.2 RH% Min/Max: 39-96 Feel Min/Max: 59 to 89 | 13 High: 74.39002 Low: 63.939224 Precip: M Avg Wind: ESE @ 4.0 RH% Min/Max: 49-77 Feel Min/Max: 64 to 74 | 14 High: 65.35042 Low: 59.2808 Precip: M Avg Wind: E @ 4.8 RH% Min/Max: 72-88 Feel Min/Max: 59 to 65 |
| 15 High: 66.57979 Low: 58.850574 Precip: M Avg Wind: ESE @ 4.1 RH% Min/Max: 63-81 Feel Min/Max: 59 to 67 | 16 High: 67.51038 Low: 59.309586 Precip: M Avg Wind: ESE @ 6.2 RH% Min/Max: 75-97 Feel Min/Max: 59 to 68 | 17 High: 65.24962 Low: 61.129414 Precip: M Avg Wind: ESE @ 4.9 RH% Min/Max: 96-100 Feel Min/Max: 61 to 65 | 18 High: 80.20937 Low: 63.51982 Precip: M Avg Wind: SSE @ 3.3 RH% Min/Max: 74-100 Feel Min/Max: 64 to 84 | 19 High: 89.16081 Low: 66.70937 Precip: M Avg Wind: WSW @ 4.1 RH% Min/Max: 62-100 Feel Min/Max: 67 to 100 | 20 High: 85.139595 Low: 67.74978 Precip: M Avg Wind: NW @ 5.3 RH% Min/Max: 43-92 Feel Min/Max: 68 to 85 | 21 High: 87.40041 Low: 64.49002 Precip: M RH% Min/Max: 48-93 Feel Min/Max: 64 to 90 |
| 22 Precip: M | 23 | 24 | 25 | 26 | 27 | 28 |
| 29 | 30 | 01 | 02 | 03 | 04 | 05 |
The data presented here provided by IEM API webservice: daily.json. A simple CSV option exists as well.
Daily High/Low Plot

Description: This chart of the monthly temperature data. The bars are the observations and the dots are climatology.
Daily Rainfall
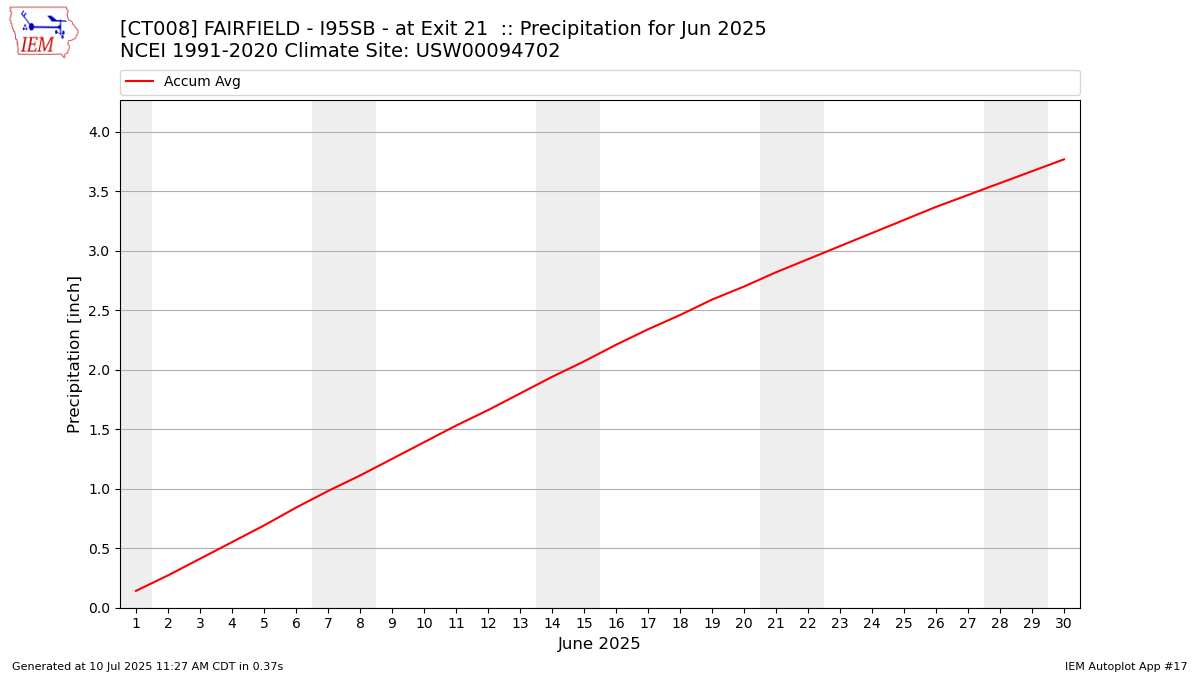
Description: This chart is of daily precipitation for the month. The red line would be an average month while the blue line and bars are observations.
Daily Average Wind Speeds
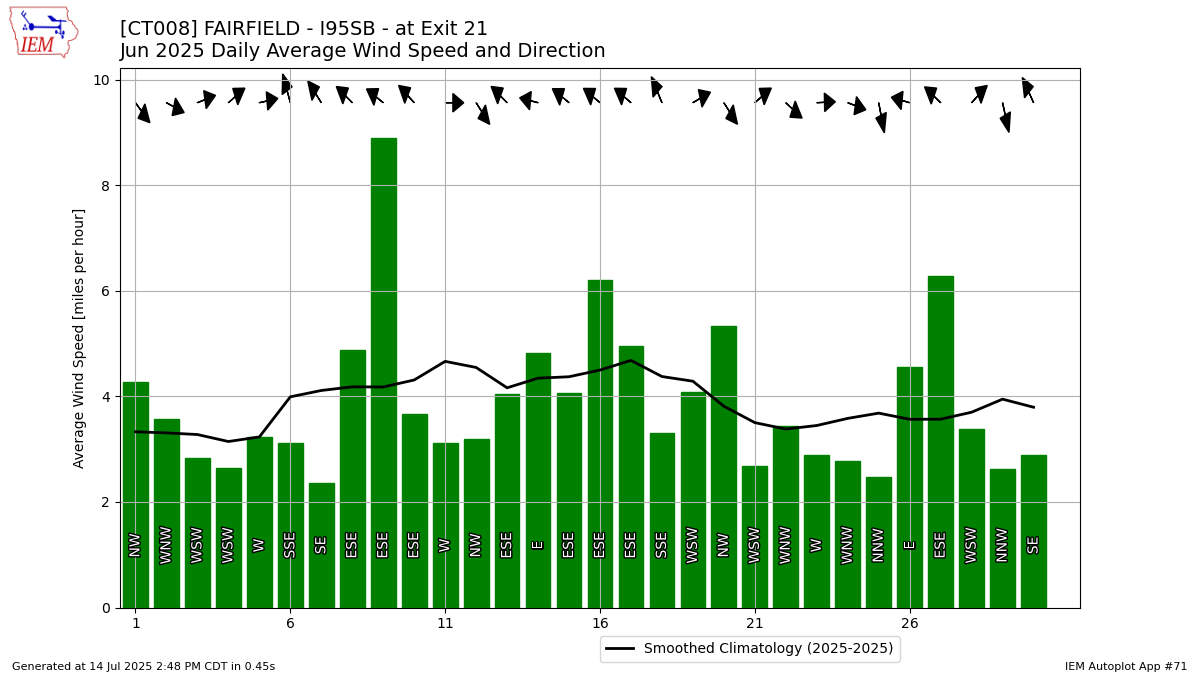
Description: This chart is of the daily average wind speeds.
The data presented here provided by IEM API webservice: daily.json. A simple CSV option exists as well.