| May 2025 | Jun 2025 | Jul 2025 | ||||
|---|---|---|---|---|---|---|
| Sunday | Monday | Tuesday | Wednesday | Thursday | Friday | Saturday |
| 01 High: 64.770775 Low: 49.33037 Precip: M Avg Wind: WNW @ 2.7 RH% Min/Max: 49-87 Feel Min/Max: 48 to 65 | 02 High: 72.550415 Low: 48.509583 Precip: M Avg Wind: WNW @ 1.6 RH% Min/Max: 44-97 Feel Min/Max: 49 to 73 | 03 High: 79.39941 Low: 48.680588 Precip: M Avg Wind: W @ 1.3 RH% Min/Max: 29-99 Feel Min/Max: 49 to 79 | 04 High: 81.46038 Low: 52.890823 Precip: M Avg Wind: S @ 1.4 RH% Min/Max: 46-94 Feel Min/Max: 53 to 83 | 05 High: 88.75942 Low: 59.12062 Precip: M Avg Wind: W @ 1.4 RH% Min/Max: 50-100 Feel Min/Max: 59 to 94 | 06 High: 84.30079 Low: 66.9308 Precip: M Avg Wind: ESE @ 1.5 RH% Min/Max: 61-100 Feel Min/Max: 67 to 89 | 07 High: 75.64999 Low: 62.76918 Precip: M Avg Wind: ESE @ 1.1 RH% Min/Max: 85-100 Feel Min/Max: 63 to 76 |
| 08 High: 76.330376 Low: 59.820778 Precip: M Avg Wind: E @ 2.4 RH% Min/Max: 65-100 Feel Min/Max: 60 to 76 | 09 High: 62.76918 Low: 60.009796 Precip: M Avg Wind: ESE @ 3.7 RH% Min/Max: 85-100 Feel Min/Max: 60 to 63 | 10 High: 71.49919 Low: 60.74061 Precip: M Avg Wind: E @ 1.3 RH% Min/Max: 88-100 Feel Min/Max: 61 to 71 | 11 High: 82.610596 Low: 58.879414 Precip: M Avg Wind: W @ 1.7 RH% Min/Max: 45-100 Feel Min/Max: 59 to 84 | 12 High: 87.83059 Low: 65.13981 Precip: M Avg Wind: WNW @ 2.3 RH% Min/Max: 40-81 Feel Min/Max: 65 to 91 | 13 High: 75.819176 Low: 61.989807 Precip: M Avg Wind: ESE @ 2.2 RH% Min/Max: 49-81 Feel Min/Max: 62 to 76 | 14 High: 64.9598 Low: 58.319607 Precip: M Avg Wind: NE @ 1.2 RH% Min/Max: 78-95 Feel Min/Max: 58 to 65 |
| 15 High: 68.5292 Low: 57.54919 Precip: M Avg Wind: E @ 1.2 RH% Min/Max: 66-89 Feel Min/Max: 58 to 69 | 16 High: 69.15921 Low: 56.789597 Precip: M Avg Wind: ESE @ 2.5 RH% Min/Max: 73-100 Feel Min/Max: 57 to 69 | 17 High: 64.9598 Low: 60.560596 Precip: M Avg Wind: ESE @ 2.0 RH% Min/Max: 100-100 Feel Min/Max: 61 to 65 | 18 High: 81.2606 Low: 63.140022 Precip: M Avg Wind: ESE @ 1.6 RH% Min/Max: 78-100 Feel Min/Max: 63 to 87 | 19 High: 90.57019 Low: 66.750786 Precip: M Avg Wind: SW @ 2.0 RH% Min/Max: 62-100 Feel Min/Max: 67 to 103 | 20 High: 83.46023 Low: 66.57078 Precip: M Avg Wind: WNW @ 3.0 RH% Min/Max: 47-96 Feel Min/Max: 67 to 85 | 21 High: 86.6606 Low: 63.3308 Precip: M Avg Wind: SE @ 1.3 RH% Min/Max: 52-96 Feel Min/Max: 63 to 91 |
| 22 High: 90.89061 Low: 70.9808 Precip: M Avg Wind: W @ 1.6 RH% Min/Max: 64-100 Feel Min/Max: 71 to 106 | 23 High: 95.97019 Low: 75.270195 Precip: M Avg Wind: SW @ 1.3 RH% Min/Max: 62-100 Feel Min/Max: 75 to 120 | 24 High: 98.8808 Low: 73.2308 Precip: M Avg Wind: NNW @ 1.0 RH% Min/Max: 42-100 Feel Min/Max: 73 to 114 | 25 High: 95.97019 Low: 74.37019 Precip: M Avg Wind: NNE @ 1.0 RH% Min/Max: 47-100 Feel Min/Max: 74 to 110 | 26 High: 81.08959 Low: 62.40921 Precip: M Avg Wind: NE @ 1.2 RH% Min/Max: 69-100 Feel Min/Max: 62 to 87 | 27 High: 72.37041 Low: 62.27957 Precip: M Avg Wind: ESE @ 2.6 RH% Min/Max: 49-89 Feel Min/Max: 62 to 72 | 28 High: 84.46998 Low: 63.249775 Precip: M Avg Wind: SSW @ 1.9 RH% Min/Max: 63-100 Feel Min/Max: 63 to 92 |
| 29 High: 82.27041 Low: 71.67019 Precip: M RH% Min/Max: 74-100 Feel Min/Max: 72 to 88 | 30 Precip: M | 01 | 02 | 03 | 04 | 05 |
The data presented here provided by IEM API webservice: daily.json. A simple CSV option exists as well.
Daily High/Low Plot
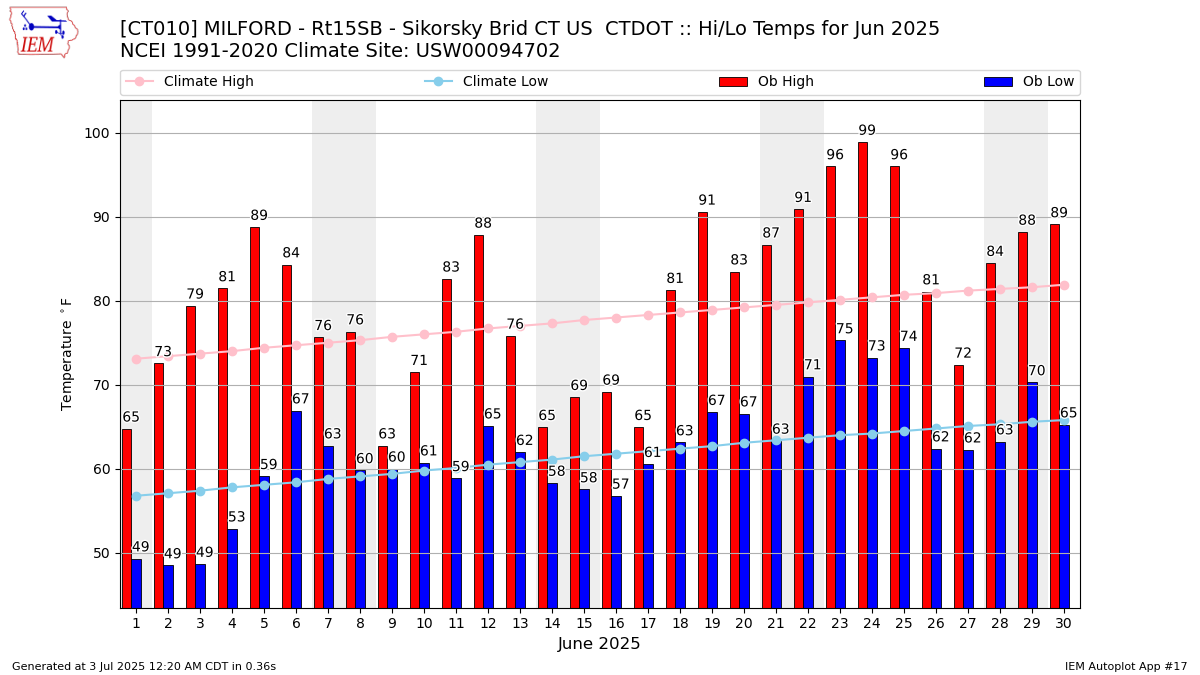
Description: This chart of the monthly temperature data. The bars are the observations and the dots are climatology.
Daily Rainfall
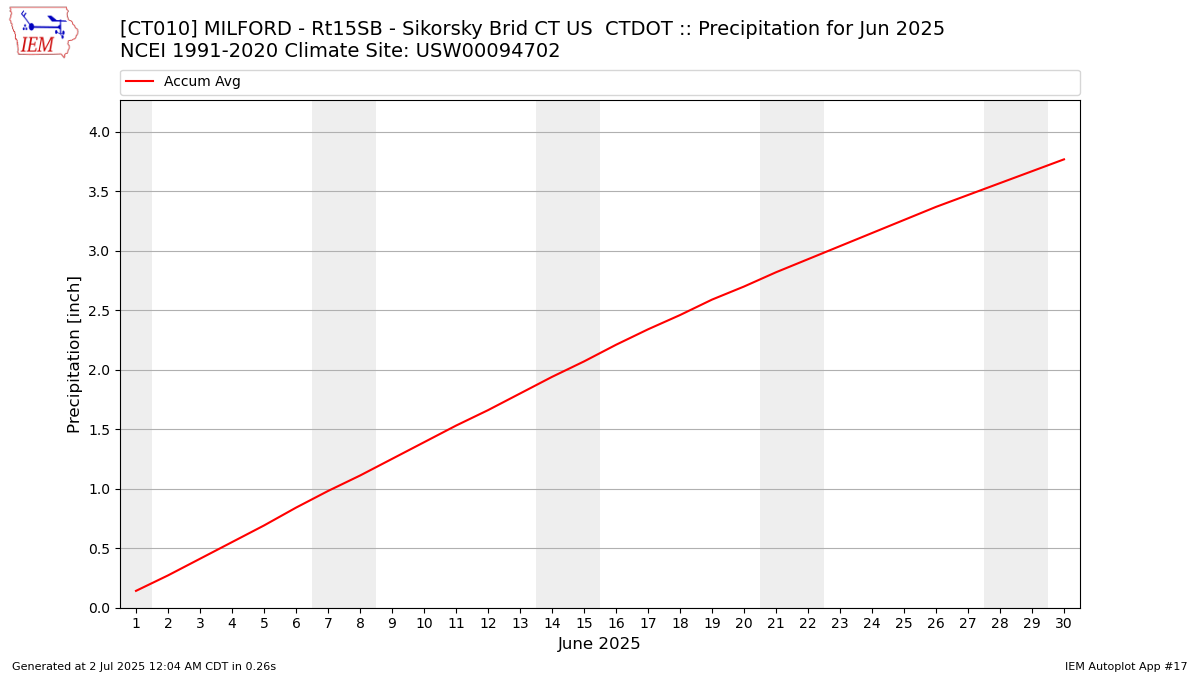
Description: This chart is of daily precipitation for the month. The red line would be an average month while the blue line and bars are observations.
Daily Average Wind Speeds

Description: This chart is of the daily average wind speeds.
The data presented here provided by IEM API webservice: daily.json. A simple CSV option exists as well.