| May 2025 | Jun 2025 | Jul 2025 | ||||
|---|---|---|---|---|---|---|
| Sunday | Monday | Tuesday | Wednesday | Thursday | Friday | Saturday |
| 01 High: 63.3308 Low: 46.74018 Precip: M Avg Wind: NNW @ 2.5 RH% Min/Max: 50-98 Feel Min/Max: 47 to 63 | 02 High: 71.16081 Low: 47.390022 Precip: M Avg Wind: NNW @ 1.8 RH% Min/Max: 42-95 Feel Min/Max: 47 to 71 | 03 High: 80.9204 Low: 49.33037 Precip: M Avg Wind: E @ 1.5 RH% Min/Max: 26-80 Feel Min/Max: 49 to 80 | 04 High: 83.800415 Low: 59.44999 Precip: M Avg Wind: ESE @ 1.9 RH% Min/Max: 47-76 Feel Min/Max: 59 to 85 | 05 High: 91.21998 Low: 65.31982 Precip: M Avg Wind: E @ 1.5 RH% Min/Max: 48-92 Feel Min/Max: 65 to 98 | 06 High: 86.14941 Low: 66.750786 Precip: M Avg Wind: ENE @ 1.6 RH% Min/Max: 62-100 Feel Min/Max: 67 to 93 | 07 High: 70.9808 Low: 61.309425 Precip: M Avg Wind: N @ 1.3 RH% Min/Max: 100-100 Feel Min/Max: 61 to 71 |
| 08 High: 75.93981 Low: 57.16939 Precip: M Avg Wind: NW @ 1.2 RH% Min/Max: 61-100 Feel Min/Max: 57 to 76 | 09 High: 69.229416 Low: 57.83 Precip: M Avg Wind: WNW @ 1.2 RH% Min/Max: 77-100 Feel Min/Max: 58 to 69 | 10 High: 71.67019 Low: 59.640823 Precip: M Avg Wind: NNW @ 1.2 RH% Min/Max: 94-100 Feel Min/Max: 60 to 72 | 11 High: 80.40921 Low: 58.319607 Precip: M Avg Wind: NNE @ 1.9 RH% Min/Max: 51-100 Feel Min/Max: 58 to 81 | 12 High: 86.14941 Low: 66.19999 Precip: M Avg Wind: NNW @ 2.5 RH% Min/Max: 40-78 Feel Min/Max: 66 to 87 | 13 High: 80.9204 Low: 61.309425 Precip: M Avg Wind: NE @ 1.6 RH% Min/Max: 42-79 Feel Min/Max: 61 to 81 | 14 High: 63.480213 Low: 56.600574 Precip: M Avg Wind: NNW @ 1.4 RH% Min/Max: 70-100 Feel Min/Max: 57 to 63 |
| 15 High: 67.98922 Low: 56.01918 Precip: M Avg Wind: N @ 0.9 RH% Min/Max: 67-99 Feel Min/Max: 56 to 68 | 16 High: 75.64999 Low: 55.430588 Precip: M Avg Wind: ESE @ 1.4 RH% Min/Max: 58-100 Feel Min/Max: 55 to 76 | 17 High: 66.39082 Low: 58.89919 Precip: M Avg Wind: NW @ 0.9 RH% Min/Max: 97-100 Feel Min/Max: 59 to 66 | 18 High: 77.7002 Low: 63.3308 Precip: M Avg Wind: ESE @ 1.3 RH% Min/Max: 86-100 Feel Min/Max: 63 to 78 | 19 High: 89.86998 Low: 68.5292 Precip: M Avg Wind: ESE @ 2.0 RH% Min/Max: 60-100 Feel Min/Max: 69 to 101 | 20 High: 81.699776 Low: 65.49978 Precip: M Avg Wind: NNW @ 3.2 RH% Min/Max: 46-100 Feel Min/Max: 65 to 83 | 21 High: 86.03059 Low: 61.48938 Precip: M RH% Min/Max: 50-91 Feel Min/Max: 61 to 89 |
| 22 Precip: M | 23 | 24 | 25 | 26 | 27 | 28 |
| 29 | 30 | 01 | 02 | 03 | 04 | 05 |
The data presented here provided by IEM API webservice: daily.json. A simple CSV option exists as well.
Daily High/Low Plot
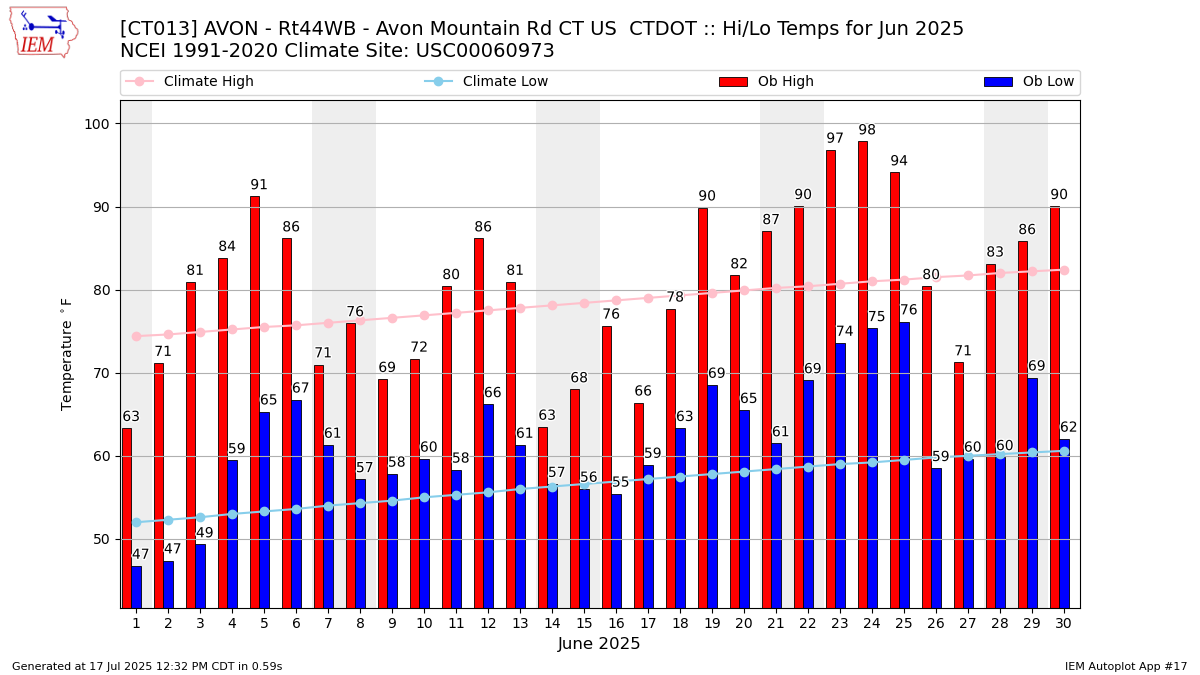
Description: This chart of the monthly temperature data. The bars are the observations and the dots are climatology.
Daily Rainfall
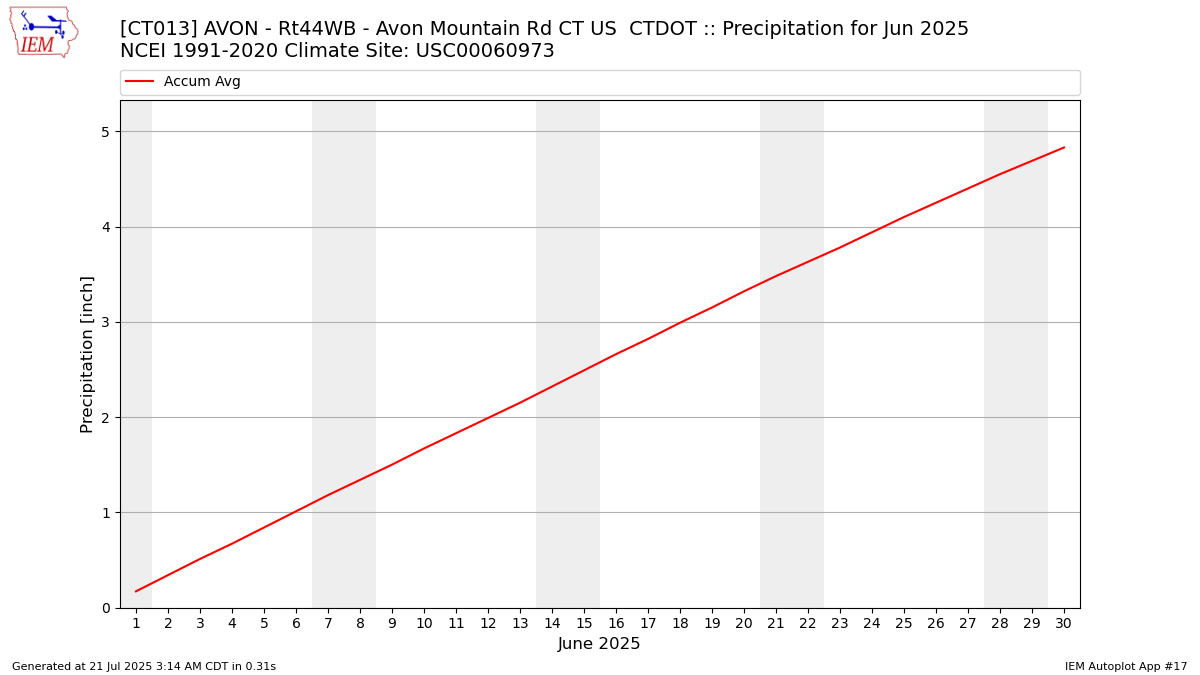
Description: This chart is of daily precipitation for the month. The red line would be an average month while the blue line and bars are observations.
Daily Average Wind Speeds
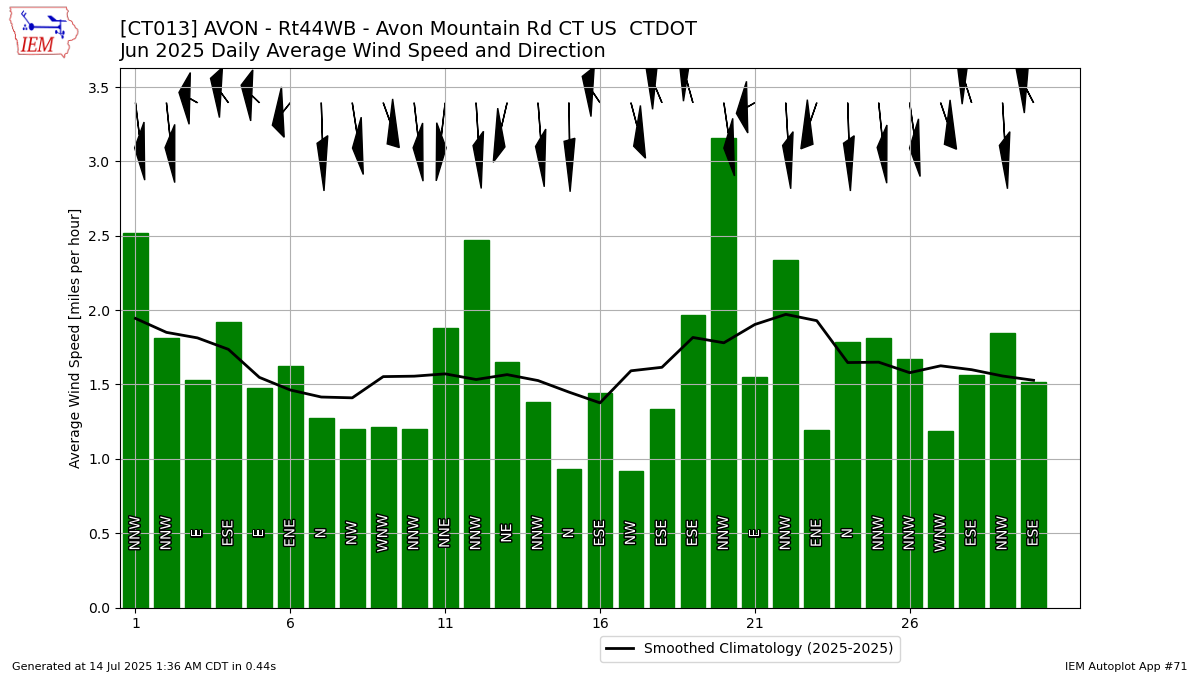
Description: This chart is of the daily average wind speeds.
The data presented here provided by IEM API webservice: daily.json. A simple CSV option exists as well.