| May 2025 | Jun 2025 | Jul 2025 | ||||
|---|---|---|---|---|---|---|
| Sunday | Monday | Tuesday | Wednesday | Thursday | Friday | Saturday |
| 01 High: 57.189224 Low: 42.420193 Precip: M Avg Wind: WNW @ 3.8 RH% Min/Max: 56-98 Feel Min/Max: 41 to 57 | 02 High: 62.839382 Low: 41.059425 Precip: M Avg Wind: NW @ 1.4 RH% Min/Max: 53-100 Feel Min/Max: 41 to 63 | 03 High: 63.769978 Low: 41.41939 Precip: M Avg Wind: E @ 0.8 RH% Min/Max: 45-94 Feel Min/Max: 41 to 64 | 04 High: 71.6792 Low: 53.020405 Precip: M Avg Wind: ESE @ 2.1 RH% Min/Max: 54-87 Feel Min/Max: 53 to 72 | 05 High: 75.329575 Low: 61.59919 Precip: M Avg Wind: E @ 1.3 RH% Min/Max: 74-97 Feel Min/Max: 62 to 75 | 06 High: 74.01918 Low: 61.86918 Precip: M Avg Wind: NNW @ 2.5 RH% Min/Max: 75-100 Feel Min/Max: 62 to 74 | 07 High: 67.089226 Low: 55.459427 Precip: M Avg Wind: E @ 1.2 RH% Min/Max: 98-100 Feel Min/Max: 55 to 67 |
| 08 High: 70.0502 Low: 52.9106 Precip: M Avg Wind: ESE @ 3.0 RH% Min/Max: 69-100 Feel Min/Max: 53 to 70 | 09 High: 63.019394 Low: 54.390182 Precip: M Avg Wind: ESE @ 4.4 RH% Min/Max: 85-100 Feel Min/Max: 54 to 63 | 10 High: 70.34002 Low: 57.54919 Precip: M Avg Wind: WSW @ 2.1 RH% Min/Max: 85-100 Feel Min/Max: 58 to 70 | 11 High: 71.65041 Low: 51.909798 Precip: M Avg Wind: NW @ 1.7 RH% Min/Max: 59-100 Feel Min/Max: 52 to 72 | 12 High: 72.660225 Low: 60.81982 Precip: M Avg Wind: WNW @ 2.3 RH% Min/Max: 50-88 Feel Min/Max: 61 to 73 | 13 High: 68.9792 Low: 53.479416 Precip: M Avg Wind: N @ 1.5 RH% Min/Max: 55-88 Feel Min/Max: 53 to 69 | 14 High: 59.970192 Low: 53.59999 Precip: M Avg Wind: ESE @ 3.1 RH% Min/Max: 80-98 Feel Min/Max: 54 to 60 |
| 15 High: 64.5494 Low: 53.470406 Precip: M Avg Wind: ESE @ 2.0 RH% Min/Max: 76-100 Feel Min/Max: 53 to 65 | 16 High: 69.490395 Low: 50.540024 Precip: M Avg Wind: SSE @ 2.4 RH% Min/Max: 60-100 Feel Min/Max: 51 to 69 | 17 High: 64.619606 Low: 57.09018 Precip: M Avg Wind: SE @ 3.8 RH% Min/Max: 69-100 Feel Min/Max: 57 to 65 | 18 High: 71.02941 Low: 61.9808 Precip: M Avg Wind: SSE @ 1.9 RH% Min/Max: 93-100 Feel Min/Max: 62 to 71 | 19 High: 75.3494 Low: 69.220406 Precip: M Avg Wind: SSW @ 1.9 RH% Min/Max: 82-100 Feel Min/Max: 69 to 75 | 20 High: 74.60958 Low: 58.35921 Precip: M Avg Wind: WNW @ 4.6 RH% Min/Max: 52-94 Feel Min/Max: 58 to 75 | 21 High: 73.4396 Low: 55.040024 Precip: M Avg Wind: SE @ 1.5 RH% Min/Max: 75-100 Feel Min/Max: 55 to 73 |
| 22 High: 77.95937 Low: 66.9308 Precip: M Avg Wind: NW @ 2.9 RH% Min/Max: 72-100 Feel Min/Max: 67 to 78 | 23 High: 78.42019 Low: 68.37078 Precip: M Avg Wind: NE @ 0.5 RH% Min/Max: 92-100 Feel Min/Max: 68 to 78 | 24 High: 80.690025 Low: 69.29061 Precip: M Avg Wind: WNW @ 1.2 RH% Min/Max: 67-100 Feel Min/Max: 69 to 84 | 25 High: 78.96918 Low: 72.339806 Precip: M RH% Min/Max: 70-89 Feel Min/Max: 72 to 79 | 26 Precip: M | 27 Precip: M | 28 |
| 29 | 30 | 01 | 02 | 03 | 04 | 05 |
The data presented here provided by IEM API webservice: daily.json. A simple CSV option exists as well.
Daily High/Low Plot
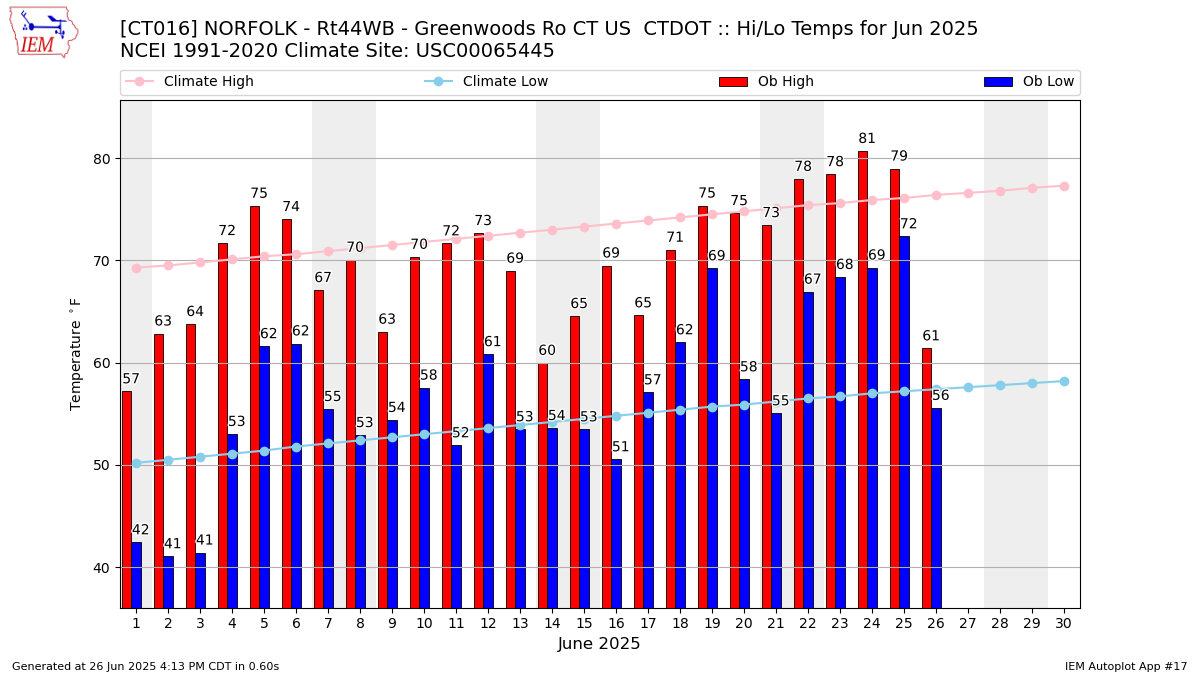
Description: This chart of the monthly temperature data. The bars are the observations and the dots are climatology.
Daily Rainfall
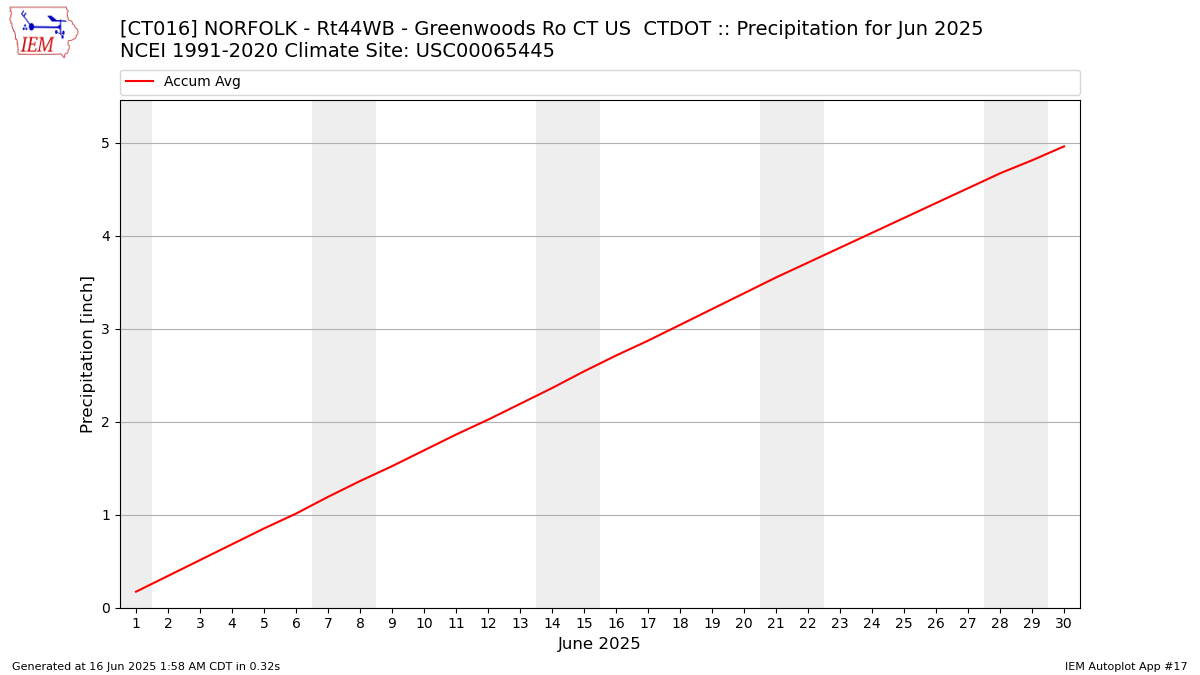
Description: This chart is of daily precipitation for the month. The red line would be an average month while the blue line and bars are observations.
Daily Average Wind Speeds
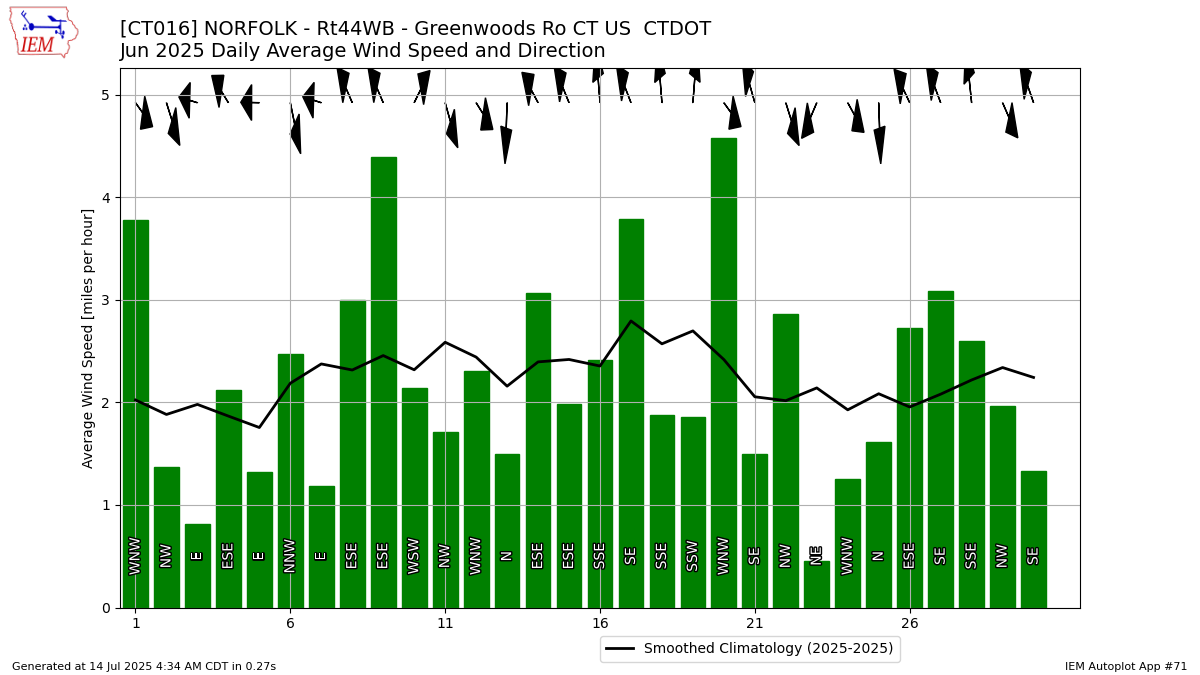
Description: This chart is of the daily average wind speeds.
The data presented here provided by IEM API webservice: daily.json. A simple CSV option exists as well.