| Jun 2025 | Jul 2025 | Aug 2025 | ||||
|---|---|---|---|---|---|---|
| Sunday | Monday | Tuesday | Wednesday | Thursday | Friday | Saturday |
| 29 | 30 | 01 High: 91.770775 Low: 70.53981 Precip: M Avg Wind: W @ 2.7 RH% Min/Max: 59-100 Feel Min/Max: 71 to 104 | 02 High: 85.020775 Low: 67.38981 Precip: M Avg Wind: N @ 1.4 RH% Min/Max: 57-100 Feel Min/Max: 67 to 89 | 03 High: 83.969604 Low: 57.590607 Precip: M Avg Wind: NNW @ 1.7 RH% Min/Max: 58-100 Feel Min/Max: 58 to 88 | 04 High: 78.31939 Low: 53.299404 Precip: M Avg Wind: W @ 2.1 RH% Min/Max: 45-100 Feel Min/Max: 53 to 78 | 05 High: 83.29999 Low: 51.789223 Precip: M Avg Wind: NW @ 1.6 RH% Min/Max: 47-100 Feel Min/Max: 52 to 85 |
| 06 High: 89.97078 Low: 64.34061 Precip: M Avg Wind: NNW @ 2.7 RH% Min/Max: 57-98 Feel Min/Max: 64 to 102 | 07 High: 89.27062 Low: 68.419395 Precip: M Avg Wind: N @ 2.3 RH% Min/Max: 68-100 Feel Min/Max: 68 to 103 | 08 High: 87.000786 Low: 72.51982 Precip: M Avg Wind: N @ 1.3 RH% Min/Max: 73-100 Feel Min/Max: 73 to 100 | 09 High: 74.55921 Low: 72.51982 Precip: M RH% Min/Max: 97-100 Feel Min/Max: 73 to 75 | 10 Precip: M | 11 | 12 |
| 13 | 14 | 15 | 16 | 17 | 18 | 19 |
| 20 | 21 | 22 | 23 | 24 | 25 | 26 |
| 27 | 28 | 29 | 30 | 31 | 01 | 02 |
The data presented here provided by IEM API webservice: daily.json. A simple CSV option exists as well.
Daily High/Low Plot
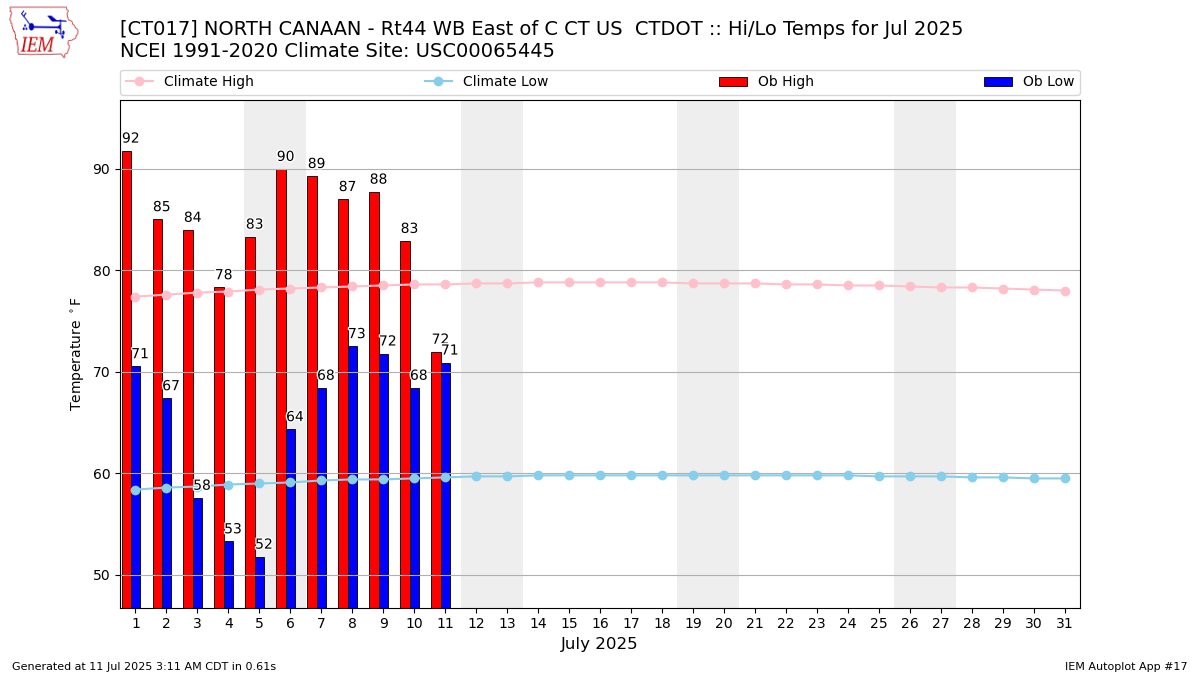
Description: This chart of the monthly temperature data. The bars are the observations and the dots are climatology.
Daily Rainfall

Description: This chart is of daily precipitation for the month. The red line would be an average month while the blue line and bars are observations.
Daily Average Wind Speeds
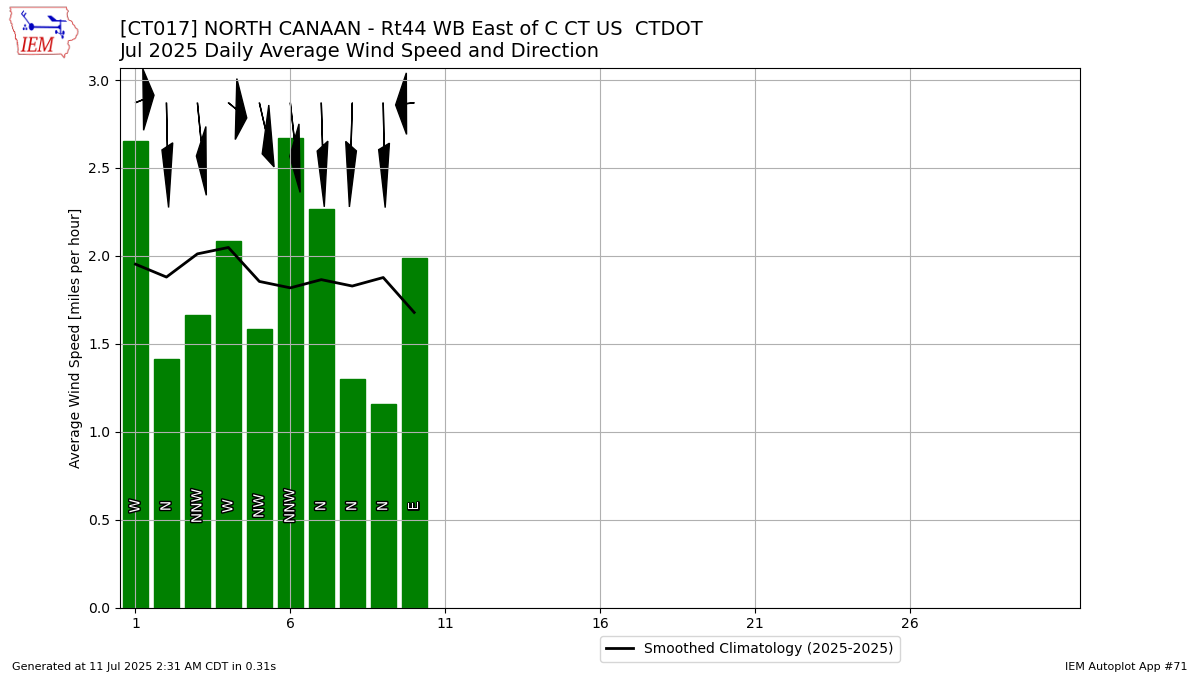
Description: This chart is of the daily average wind speeds.
The data presented here provided by IEM API webservice: daily.json. A simple CSV option exists as well.