| May 2025 | Jun 2025 | Jul 2025 | ||||
|---|---|---|---|---|---|---|
| Sunday | Monday | Tuesday | Wednesday | Thursday | Friday | Saturday |
| 01 High: 67.3196 Low: 50.680428 Precip: M Avg Wind: WSW @ 5.3 RH% Min/Max: 40-76 Feel Min/Max: 51 to 67 | 02 High: 75.3098 Low: 54.080585 Precip: M Avg Wind: WSW @ 3.2 RH% Min/Max: 39-79 Feel Min/Max: 54 to 75 | 03 High: 83.15057 Low: 51.459797 Precip: M Avg Wind: SSW @ 2.1 RH% Min/Max: 27-90 Feel Min/Max: 51 to 82 | 04 High: 85.2098 Low: 55.39999 Precip: M Avg Wind: SSW @ 1.8 RH% Min/Max: 49-86 Feel Min/Max: 55 to 87 | 05 High: 89.549614 Low: 63.140022 Precip: M Avg Wind: SSW @ 2.7 RH% Min/Max: 52-90 Feel Min/Max: 63 to 95 | 06 High: 88.0106 Low: 69.92963 Precip: M Avg Wind: S @ 1.6 RH% Min/Max: 52-90 Feel Min/Max: 70 to 93 | 07 High: 80.92941 Low: 67.130585 Precip: M Avg Wind: N @ 1.8 RH% Min/Max: 71-97 Feel Min/Max: 67 to 85 |
| 08 High: 77.16918 Low: 63.350574 Precip: M Avg Wind: NE @ 2.6 RH% Min/Max: 61-92 Feel Min/Max: 63 to 77 | 09 High: 64.839226 Low: 60.44002 Precip: M Avg Wind: NE @ 4.2 RH% Min/Max: 86-100 Feel Min/Max: 60 to 65 | 10 High: 77.050415 Low: 62.33 Precip: M Avg Wind: NNW @ 2.0 RH% Min/Max: 74-100 Feel Min/Max: 62 to 77 | 11 High: 84.6896 Low: 61.440823 Precip: M Avg Wind: SW @ 2.8 RH% Min/Max: 40-98 Feel Min/Max: 61 to 85 | 12 High: 91.52062 Low: 66.61939 Precip: M Avg Wind: W @ 3.7 RH% Min/Max: 37-80 Feel Min/Max: 67 to 92 | 13 High: 83.080376 Low: 67.3106 Precip: M Avg Wind: N @ 2.0 RH% Min/Max: 42-73 Feel Min/Max: 67 to 83 | 14 High: 67.33938 Low: 61.010597 Precip: M Avg Wind: NE @ 4.5 RH% Min/Max: 71-90 Feel Min/Max: 61 to 67 |
| 15 High: 69.02062 Low: 60.08 Precip: M Avg Wind: NNE @ 2.5 RH% Min/Max: 61-81 Feel Min/Max: 60 to 69 | 16 High: 71.8196 Low: 62.79082 Precip: M Avg Wind: NE @ 2.9 RH% Min/Max: 70-94 Feel Min/Max: 63 to 72 | 17 High: 71.360596 Low: 62.8808 Precip: M Avg Wind: NE @ 1.8 RH% Min/Max: 81-96 Feel Min/Max: 63 to 71 | 18 High: 85.64002 Low: 66.3098 Precip: M Avg Wind: SSW @ 1.7 RH% Min/Max: 65-98 Feel Min/Max: 66 to 93 | 19 High: 91.41081 Low: 71.040184 Precip: M Avg Wind: SSW @ 2.5 RH% Min/Max: 62-93 Feel Min/Max: 71 to 105 | 20 High: 86.160225 Low: 69.24018 Precip: M Avg Wind: WSW @ 6.6 RH% Min/Max: 42-89 Feel Min/Max: 69 to 86 | 21 High: 90.21918 Low: 67.85058 Precip: M Avg Wind: SSW @ 2.2 RH% Min/Max: 45-83 Feel Min/Max: 68 to 94 |
| 22 High: 92.53938 Low: 72.19039 Precip: M Avg Wind: WSW @ 3.5 RH% Min/Max: 60-96 Feel Min/Max: 72 to 106 | 23 High: 98.1896 Low: 78.67941 Precip: M Avg Wind: SSW @ 2.2 RH% Min/Max: 58-93 Feel Min/Max: 79 to 125 | 24 High: 102.759796 Low: 75.0308 Precip: M Avg Wind: W @ 2.6 RH% Min/Max: 31-93 Feel Min/Max: 75 to 114 | 25 High: 99.750206 Low: 77.91081 Precip: M Avg Wind: WNW @ 2.9 RH% Min/Max: 41-81 Feel Min/Max: 78 to 114 | 26 High: 83.159584 Low: 66.70042 Precip: M Avg Wind: NE @ 4.1 RH% Min/Max: 61-86 Feel Min/Max: 67 to 90 | 27 High: 74.960594 Low: 65.4098 Precip: M Avg Wind: NNE @ 3.4 RH% Min/Max: 44-75 Feel Min/Max: 65 to 75 | 28 High: 69.270775 Low: 64.29919 Precip: M RH% Min/Max: 63-96 Feel Min/Max: 64 to 69 |
| 29 Precip: M | 30 | 01 | 02 | 03 | 04 | 05 |
The data presented here provided by IEM API webservice: daily.json. A simple CSV option exists as well.
Daily High/Low Plot
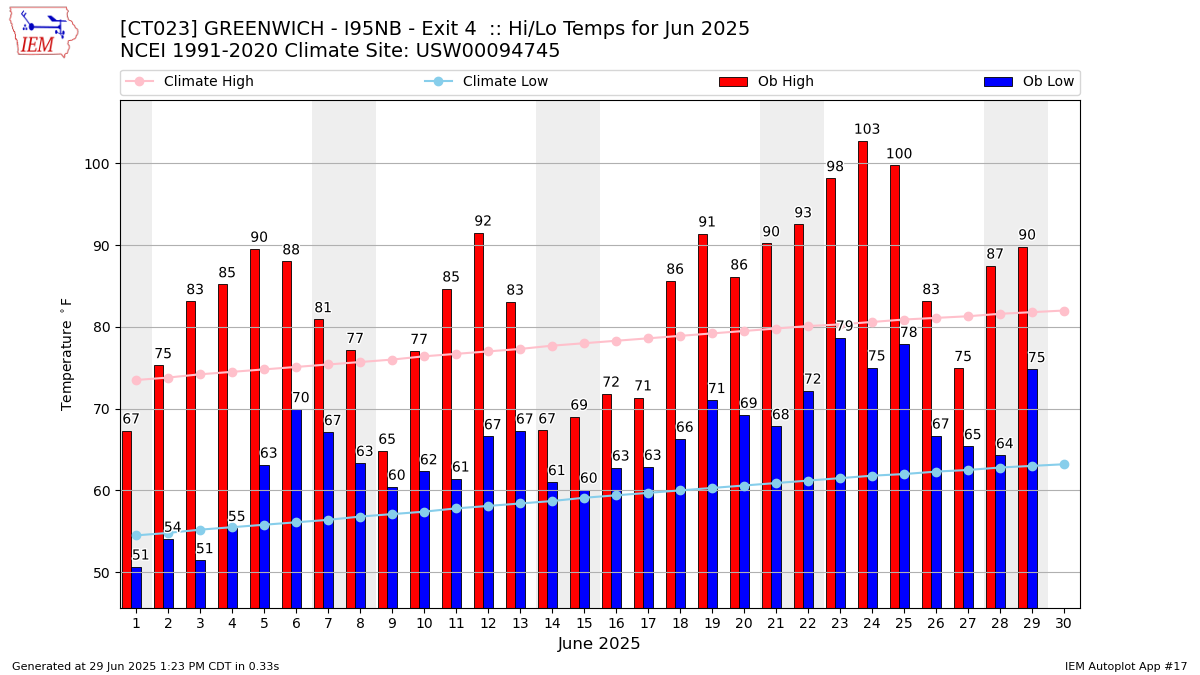
Description: This chart of the monthly temperature data. The bars are the observations and the dots are climatology.
Daily Rainfall

Description: This chart is of daily precipitation for the month. The red line would be an average month while the blue line and bars are observations.
Daily Average Wind Speeds
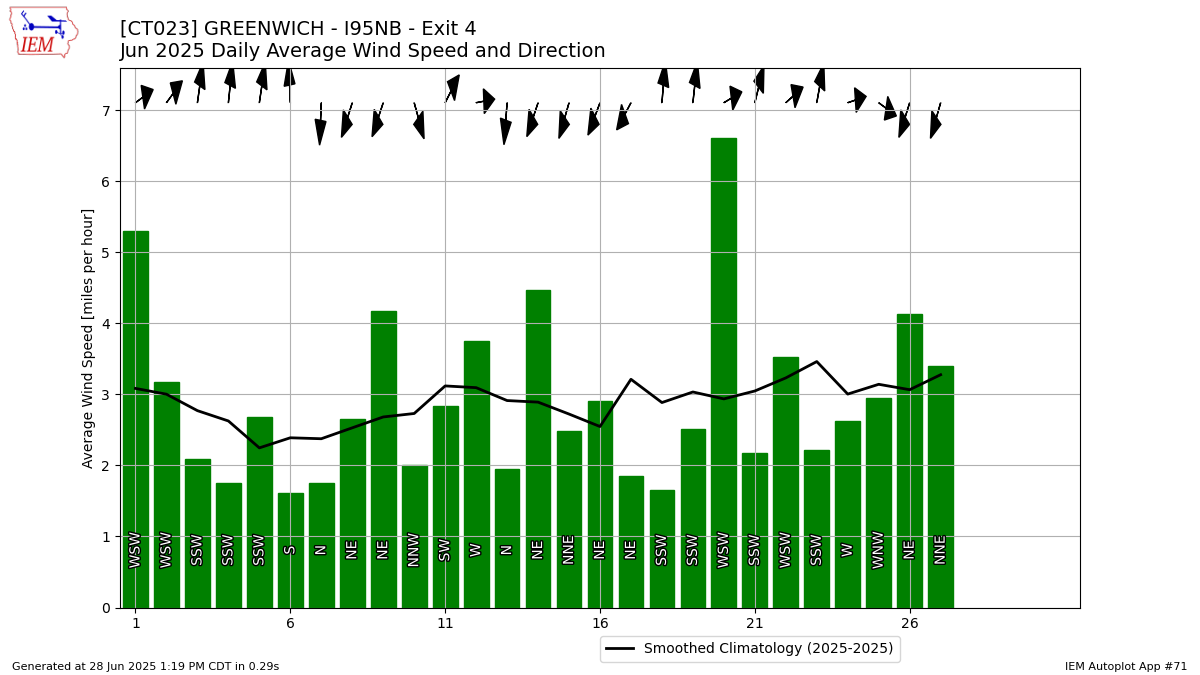
Description: This chart is of the daily average wind speeds.
The data presented here provided by IEM API webservice: daily.json. A simple CSV option exists as well.