| May 2025 | Jun 2025 | Jul 2025 | ||||
|---|---|---|---|---|---|---|
| Sunday | Monday | Tuesday | Wednesday | Thursday | Friday | Saturday |
| 01 High: 51.53 Low: 48.77062 Precip: M Avg Wind: NW @ 2.2 RH% Min/Max: 79-85 Feel Min/Max: 47 to 52 | 02 High: 49.299774 Low: 47.31081 Precip: M Avg Wind: NE @ 1.2 RH% Min/Max: 87-93 Feel Min/Max: 47 to 49 | 03 High: 71.909584 Low: 62.580215 Precip: M Avg Wind: WSW @ 3.5 RH% Min/Max: 38-54 Feel Min/Max: 63 to 72 | 04 High: 68.88922 Low: 56.359425 Precip: M Avg Wind: WSW @ 2.4 RH% Min/Max: 51-76 Feel Min/Max: 56 to 69 | 05 High: 77.25921 Low: 61.039383 Precip: M Avg Wind: ESE @ 2.9 RH% Min/Max: 70-92 Feel Min/Max: 61 to 77 | 06 High: 74.969604 Low: 69.000786 Precip: M Avg Wind: E @ 3.9 RH% Min/Max: 74-91 Feel Min/Max: 69 to 75 | 07 Precip: M Avg Wind: E @ 1.8 |
| 08 High: 64.32979 Low: 58.769608 Precip: M Avg Wind: SSE @ 2.2 RH% Min/Max: 91-100 Feel Min/Max: 59 to 64 | 09 High: 65.76081 Low: 61.35079 Precip: M Avg Wind: ESE @ 3.1 RH% Min/Max: 80-100 Feel Min/Max: 61 to 66 | 10 High: 66.95959 Low: 60.909798 Precip: M Avg Wind: ENE @ 2.8 RH% Min/Max: 95-100 Feel Min/Max: 61 to 67 | 11 High: 70.829575 Low: 56.82019 Precip: M Avg Wind: W @ 2.6 RH% Min/Max: 64-100 Feel Min/Max: 57 to 71 | 12 High: 86.54002 Low: 64.04002 Precip: M Avg Wind: NW @ 4.4 RH% Min/Max: 36-85 Feel Min/Max: 64 to 86 | 13 High: 81.76998 Low: 60.45079 Precip: M Avg Wind: W @ 2.9 RH% Min/Max: 33-78 Feel Min/Max: 60 to 81 | 14 High: 65.5808 Low: 57.619392 Precip: M Avg Wind: ENE @ 4.5 RH% Min/Max: 63-92 Feel Min/Max: 58 to 66 |
| 15 High: 70.24999 Low: 58.159424 Precip: M Avg Wind: ESE @ 3.0 RH% Min/Max: 61-83 Feel Min/Max: 58 to 70 | 16 High: 76.560814 Low: 54.370407 Precip: M Avg Wind: S @ 2.9 RH% Min/Max: 47-96 Feel Min/Max: 54 to 77 | 17 High: 65.19018 Low: 59.82979 Precip: M Avg Wind: ESE @ 2.4 RH% Min/Max: 95-100 Feel Min/Max: 60 to 65 | 18 Precip: M Avg Wind: N @ 0.0 | 19 High: 90.919395 Low: 74.42963 Precip: M Avg Wind: WSW @ 5.1 RH% Min/Max: 54-92 Feel Min/Max: 74 to 101 | 20 High: 83.22078 Low: 66.540184 Precip: M Avg Wind: NW @ 6.2 RH% Min/Max: 39-87 Feel Min/Max: 67 to 83 | 21 High: 65.84002 Low: 62.38043 Precip: M Avg Wind: S @ 0.7 RH% Min/Max: 77-88 Feel Min/Max: 62 to 66 |
| 22 Precip: M Avg Wind: N @ 0.0 | 23 Precip: M Avg Wind: N @ 0.0 | 24 Precip: M | 25 Precip: M | 26 Precip: M | 27 Precip: M Avg Wind: N @ 0.0 | 28 Precip: M |
| 29 Precip: M | 30 | 01 | 02 | 03 | 04 | 05 |
The data presented here provided by IEM API webservice: daily.json. A simple CSV option exists as well.
Daily High/Low Plot
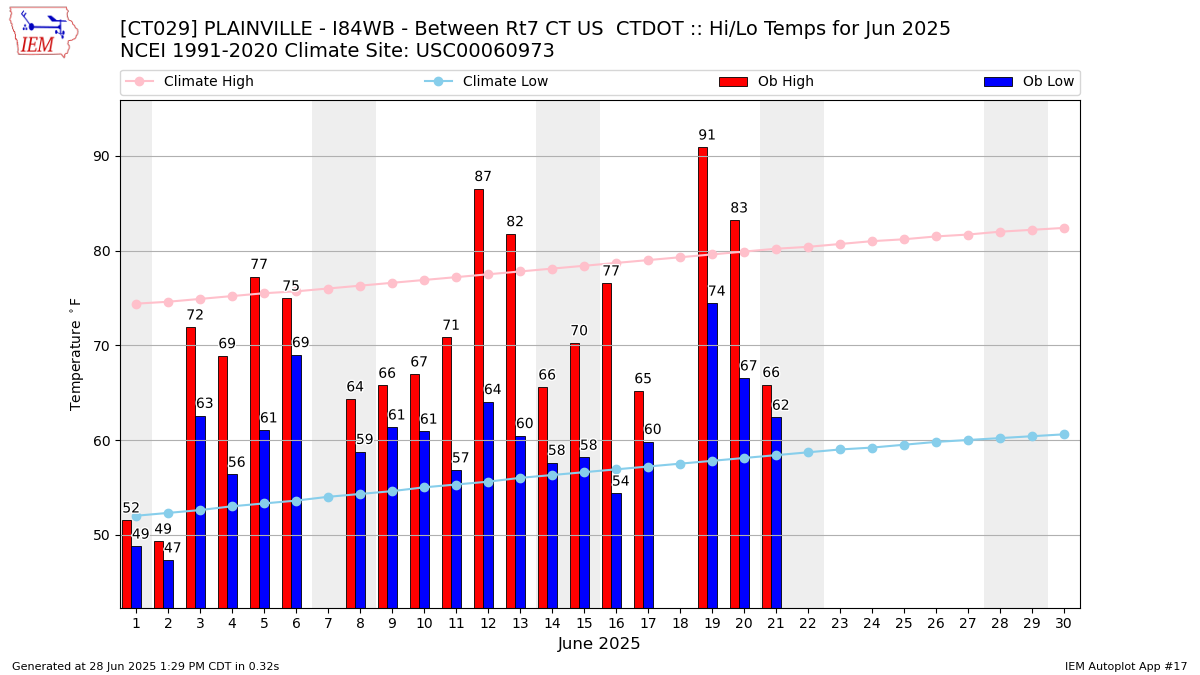
Description: This chart of the monthly temperature data. The bars are the observations and the dots are climatology.
Daily Rainfall

Description: This chart is of daily precipitation for the month. The red line would be an average month while the blue line and bars are observations.
Daily Average Wind Speeds
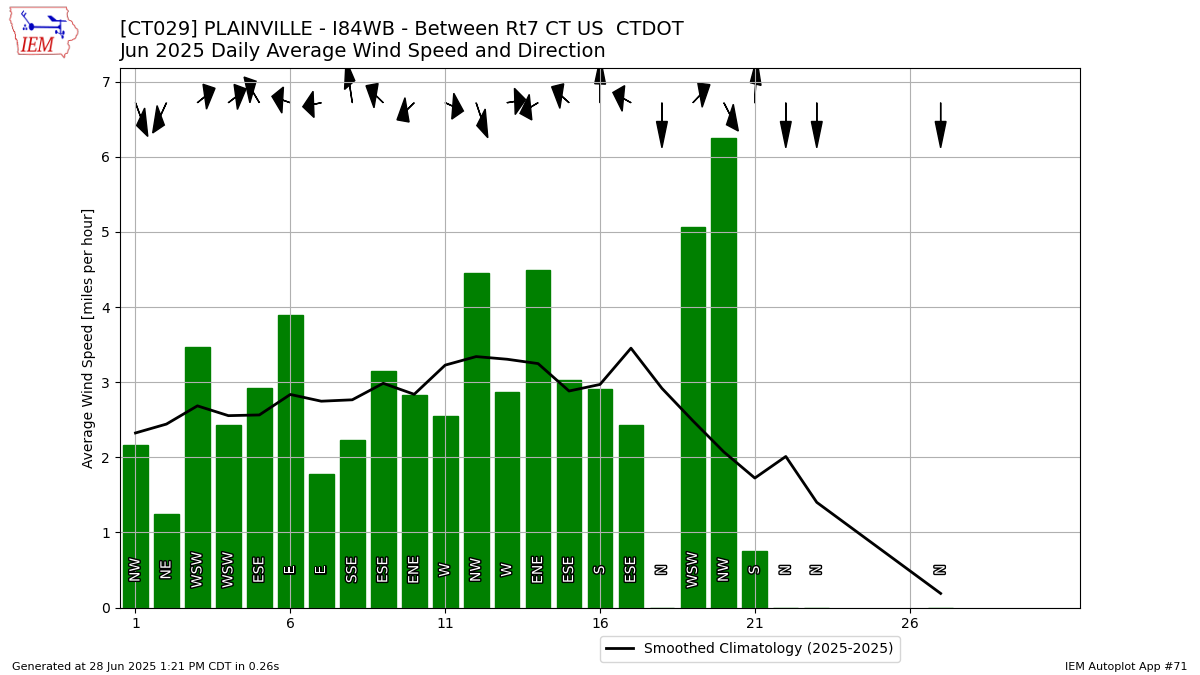
Description: This chart is of the daily average wind speeds.
The data presented here provided by IEM API webservice: daily.json. A simple CSV option exists as well.