| May 2025 | Jun 2025 | Jul 2025 | ||||
|---|---|---|---|---|---|---|
| Sunday | Monday | Tuesday | Wednesday | Thursday | Friday | Saturday |
| 01 High: 62.69002 Low: 46.070618 Precip: M Avg Wind: WNW @ 3.3 RH% Min/Max: 50-93 Feel Min/Max: 46 to 63 | 02 High: 68.95042 Low: 44.060013 Precip: M Avg Wind: WNW @ 2.5 RH% Min/Max: 47-97 Feel Min/Max: 44 to 69 | 03 High: 78.58938 Low: 42.34999 Precip: M Avg Wind: WNW @ 1.8 RH% Min/Max: 26-95 Feel Min/Max: 42 to 79 | 04 High: 78.58938 Low: 47.089382 Precip: M Avg Wind: WSW @ 2.0 RH% Min/Max: 47-93 Feel Min/Max: 47 to 79 | 05 High: 88.59018 Low: 52.849403 Precip: M Avg Wind: WSW @ 2.0 RH% Min/Max: 53-95 Feel Min/Max: 53 to 95 | 06 High: 83.94082 Low: 62.27062 Precip: M Avg Wind: SSW @ 2.2 RH% Min/Max: 62-95 Feel Min/Max: 62 to 88 | 07 High: 75.11001 Low: 61.559586 Precip: M Avg Wind: S @ 1.7 RH% Min/Max: 80-98 Feel Min/Max: 62 to 75 |
| 08 High: 77.01982 Low: 56.350418 Precip: M Avg Wind: ESE @ 2.7 RH% Min/Max: 63-98 Feel Min/Max: 56 to 77 | 09 High: 70.53981 Low: 59.640823 Precip: M Avg Wind: ESE @ 2.7 RH% Min/Max: 69-97 Feel Min/Max: 60 to 71 | 10 High: 67.049614 Low: 61.399403 Precip: M Avg Wind: NNE @ 1.7 RH% Min/Max: 95-98 Feel Min/Max: 61 to 67 | 11 High: 79.59919 Low: 52.829628 Precip: M Avg Wind: WSW @ 2.6 RH% Min/Max: 48-98 Feel Min/Max: 53 to 80 | 12 High: 87.69919 Low: 54.210224 Precip: M Avg Wind: WNW @ 2.8 RH% Min/Max: 43-95 Feel Min/Max: 54 to 89 | 13 High: 76.8308 Low: 57.14061 Precip: M Avg Wind: SSW @ 2.1 RH% Min/Max: 46-81 Feel Min/Max: 57 to 77 | 14 High: 62.04018 Low: 54.23 Precip: M Avg Wind: ENE @ 2.3 RH% Min/Max: 71-94 Feel Min/Max: 54 to 62 |
| 15 High: 69.270775 Low: 54.989594 Precip: M Avg Wind: E @ 1.8 RH% Min/Max: 65-94 Feel Min/Max: 55 to 69 | 16 High: 75.6896 Low: 53.000576 Precip: M Avg Wind: SSE @ 2.3 RH% Min/Max: 56-95 Feel Min/Max: 53 to 76 | 17 High: 66.70042 Low: 61.230213 Precip: M Avg Wind: SSE @ 1.9 RH% Min/Max: 91-98 Feel Min/Max: 61 to 67 | 18 High: 78.40041 Low: 61.230213 Precip: M Avg Wind: SW @ 1.6 RH% Min/Max: 78-99 Feel Min/Max: 61 to 78 | 19 High: 87.220406 Low: 66.36022 Precip: M Avg Wind: WSW @ 2.7 RH% Min/Max: 65-99 Feel Min/Max: 66 to 96 | 20 High: 82.669975 Low: 61.71982 Precip: M Avg Wind: WNW @ 4.7 RH% Min/Max: 45-91 Feel Min/Max: 62 to 83 | 21 High: 84.57979 Low: 55.729416 Precip: M Avg Wind: WSW @ 1.9 RH% Min/Max: 51-96 Feel Min/Max: 56 to 86 |
| 22 High: 92.11998 Low: 66.36022 Precip: M Avg Wind: WNW @ 3.0 RH% Min/Max: 53-95 Feel Min/Max: 66 to 103 | 23 High: 91.880585 Low: 67.38981 Precip: M Avg Wind: SW @ 1.7 RH% Min/Max: 61-97 Feel Min/Max: 67 to 108 | 24 High: 99.03922 Low: 67.38981 Precip: M Avg Wind: NNW @ 1.7 RH% Min/Max: 42-97 Feel Min/Max: 67 to 112 | 25 High: 95.09002 Low: 68.5994 Precip: M Avg Wind: N @ 1.9 RH% Min/Max: 46-97 Feel Min/Max: 69 to 106 | 26 High: 74.93 Low: 61.399403 Precip: M RH% Min/Max: 70-95 Feel Min/Max: 61 to 75 | 27 Precip: M | 28 |
| 29 | 30 | 01 | 02 | 03 | 04 | 05 |
The data presented here provided by IEM API webservice: daily.json. A simple CSV option exists as well.
Daily High/Low Plot
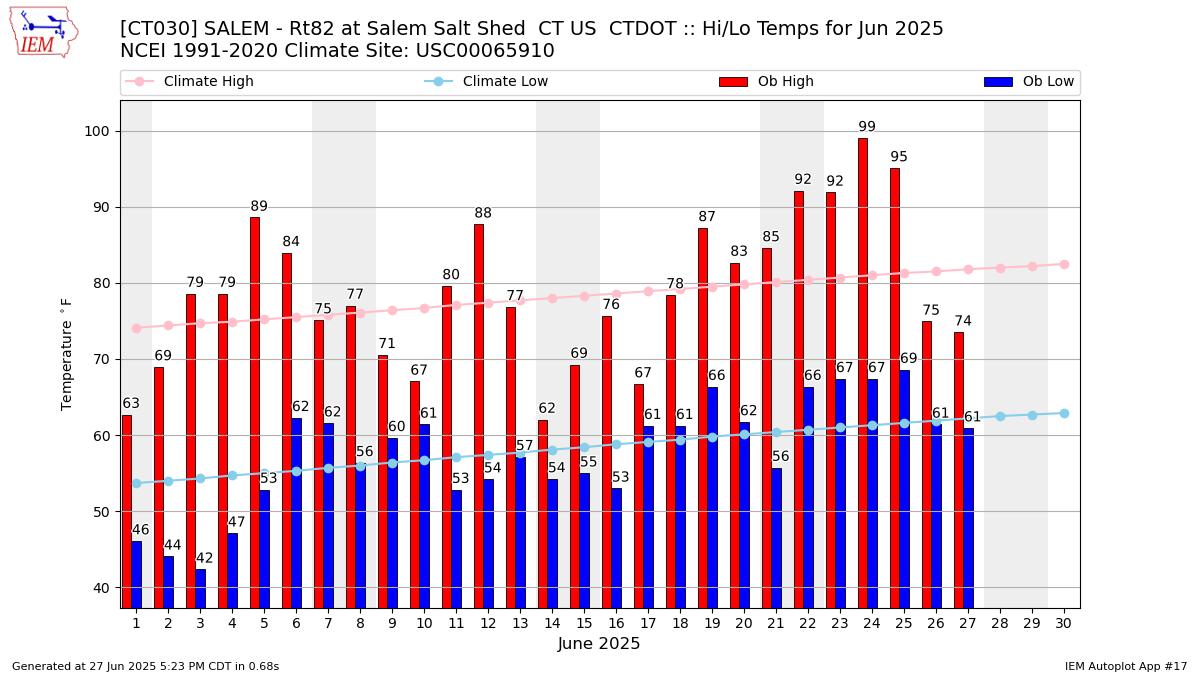
Description: This chart of the monthly temperature data. The bars are the observations and the dots are climatology.
Daily Rainfall
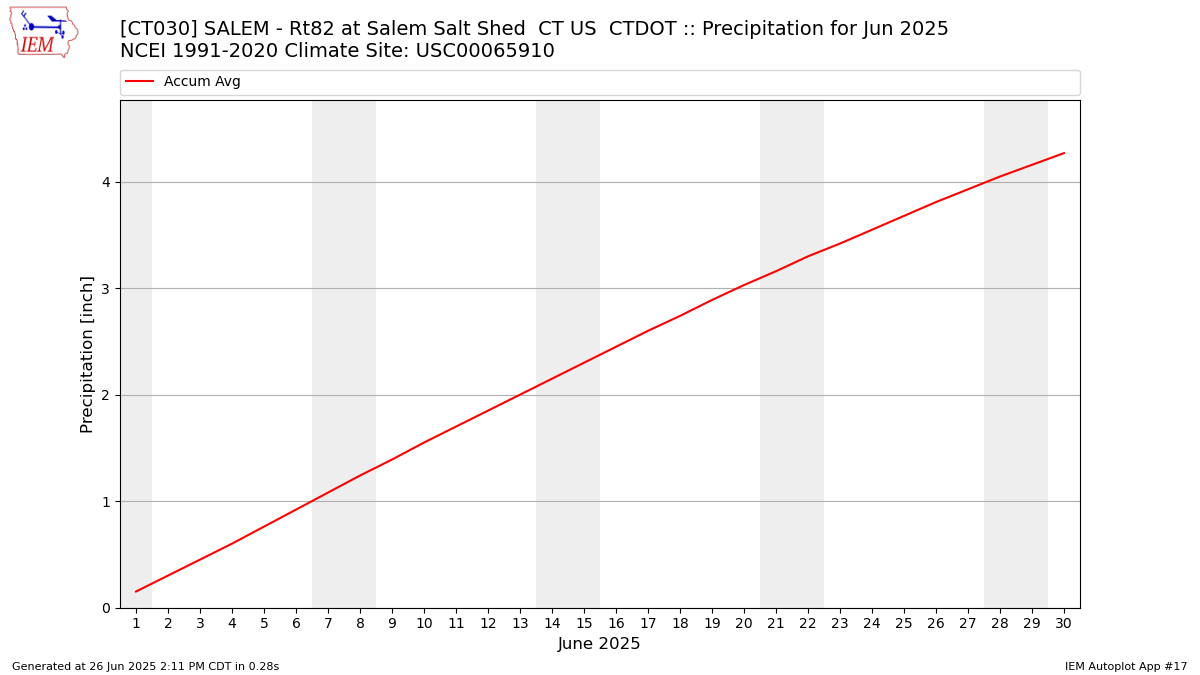
Description: This chart is of daily precipitation for the month. The red line would be an average month while the blue line and bars are observations.
Daily Average Wind Speeds
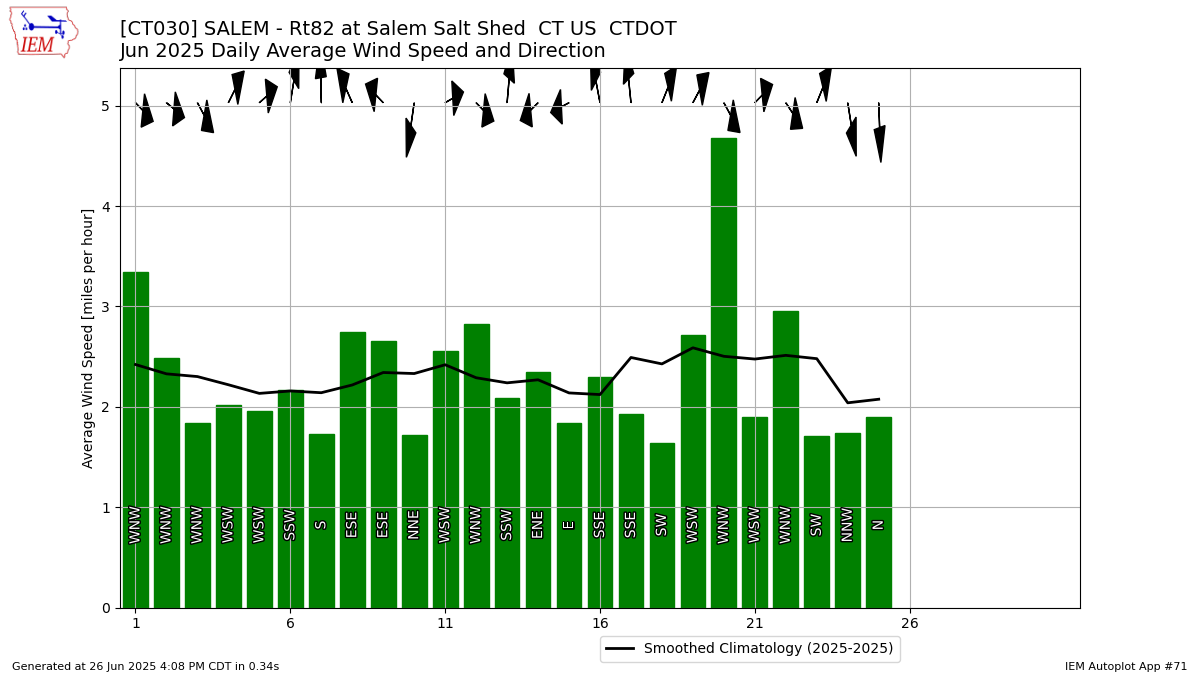
Description: This chart is of the daily average wind speeds.
The data presented here provided by IEM API webservice: daily.json. A simple CSV option exists as well.