| May 2025 | Jun 2025 | Jul 2025 | ||||
|---|---|---|---|---|---|---|
| Sunday | Monday | Tuesday | Wednesday | Thursday | Friday | Saturday |
| 01 High: 63.41001 Low: 46.63043 Precip: M Avg Wind: NW @ 1.9 RH% Min/Max: 48-96 Feel Min/Max: 47 to 63 | 02 High: 69.02062 Low: 44.439808 Precip: M Avg Wind: W @ 1.5 RH% Min/Max: 44-100 Feel Min/Max: 44 to 69 | 03 High: 79.32019 Low: 42.53 Precip: M Avg Wind: SW @ 1.4 RH% Min/Max: 23-98 Feel Min/Max: 43 to 79 | 04 High: 80.38938 Low: 49.249405 Precip: M Avg Wind: SSW @ 1.5 RH% Min/Max: 45-96 Feel Min/Max: 49 to 81 | 05 High: 89.90057 Low: 54.350574 Precip: M Avg Wind: SSE @ 1.4 RH% Min/Max: 50-99 Feel Min/Max: 54 to 95 | 06 High: 83.40079 Low: 64.81039 Precip: M Avg Wind: SSE @ 1.7 RH% Min/Max: 63-98 Feel Min/Max: 65 to 88 | 07 High: 75.540184 Low: 61.7792 Precip: M Avg Wind: SE @ 1.2 RH% Min/Max: 81-100 Feel Min/Max: 62 to 76 |
| 08 High: 74.82019 Low: 59.500416 Precip: M Avg Wind: SE @ 1.9 RH% Min/Max: 67-100 Feel Min/Max: 60 to 75 | 09 High: 70.17979 Low: 60.36081 Precip: M Avg Wind: ESE @ 1.9 RH% Min/Max: 73-99 Feel Min/Max: 60 to 70 | 10 High: 67.81998 Low: 62.560383 Precip: M Avg Wind: ESE @ 1.0 RH% Min/Max: 96-100 Feel Min/Max: 63 to 68 | 11 High: 80.6792 Low: 53.96001 Precip: M Avg Wind: SSW @ 1.4 RH% Min/Max: 47-100 Feel Min/Max: 54 to 82 | 12 High: 87.330215 Low: 59.55079 Precip: M Avg Wind: WNW @ 1.7 RH% Min/Max: 40-97 Feel Min/Max: 60 to 88 | 13 High: 76.40057 Low: 57.99919 Precip: M Avg Wind: SSE @ 1.7 RH% Min/Max: 45-86 Feel Min/Max: 58 to 76 | 14 High: 63.3308 Low: 55.410812 Precip: M Avg Wind: NNE @ 1.0 RH% Min/Max: 75-97 Feel Min/Max: 55 to 63 |
| 15 High: 69.409424 Low: 55.090393 Precip: M Avg Wind: SSE @ 1.1 RH% Min/Max: 64-98 Feel Min/Max: 55 to 69 | 16 High: 72.930214 Low: 52.71982 Precip: M Avg Wind: SSE @ 1.9 RH% Min/Max: 60-98 Feel Min/Max: 53 to 73 | 17 High: 65.93 Low: 60.929573 Precip: M Avg Wind: SE @ 1.5 RH% Min/Max: 96-100 Feel Min/Max: 61 to 66 | 18 High: 78.74962 Low: 61.9808 Precip: M Avg Wind: SSE @ 1.4 RH% Min/Max: 80-100 Feel Min/Max: 62 to 79 | 19 High: 87.580376 Low: 67.3106 Precip: M Avg Wind: SSE @ 2.1 RH% Min/Max: 62-100 Feel Min/Max: 67 to 96 | 20 High: 82.569176 Low: 62.70079 Precip: M Avg Wind: WNW @ 3.0 RH% Min/Max: 42-93 Feel Min/Max: 63 to 83 | 21 High: 84.95058 Low: 56.539383 Precip: M Avg Wind: S @ 1.5 RH% Min/Max: 49-98 Feel Min/Max: 57 to 87 |
| 22 High: 91.5494 Low: 69.4598 Precip: M Avg Wind: W @ 1.8 RH% Min/Max: 54-97 Feel Min/Max: 69 to 103 | 23 High: 93.759796 Low: 68.88922 Precip: M Avg Wind: SE @ 1.6 RH% Min/Max: 58-100 Feel Min/Max: 69 to 110 | 24 High: 99.03922 Low: 68.99002 Precip: M Avg Wind: WNW @ 1.3 RH% Min/Max: 37-99 Feel Min/Max: 69 to 109 | 25 High: 96.769394 Low: 69.490395 Precip: M Avg Wind: NW @ 1.4 RH% Min/Max: 42-99 Feel Min/Max: 69 to 105 | 26 High: 76.38981 Low: 61.66939 Precip: M Avg Wind: N @ 1.2 RH% Min/Max: 67-95 Feel Min/Max: 62 to 76 | 27 High: 72.64941 Low: 61.689224 Precip: M Avg Wind: SSE @ 1.9 RH% Min/Max: 48-91 Feel Min/Max: 62 to 73 | 28 High: 81.24978 Low: 62.04018 Precip: M Avg Wind: SSW @ 1.5 RH% Min/Max: 71-98 Feel Min/Max: 62 to 87 |
| 29 High: 79.23922 Low: 69.09978 Precip: M RH% Min/Max: 72-100 Feel Min/Max: 69 to 79 | 30 Precip: M | 01 | 02 | 03 | 04 | 05 |
The data presented here provided by IEM API webservice: daily.json. A simple CSV option exists as well.
Daily High/Low Plot
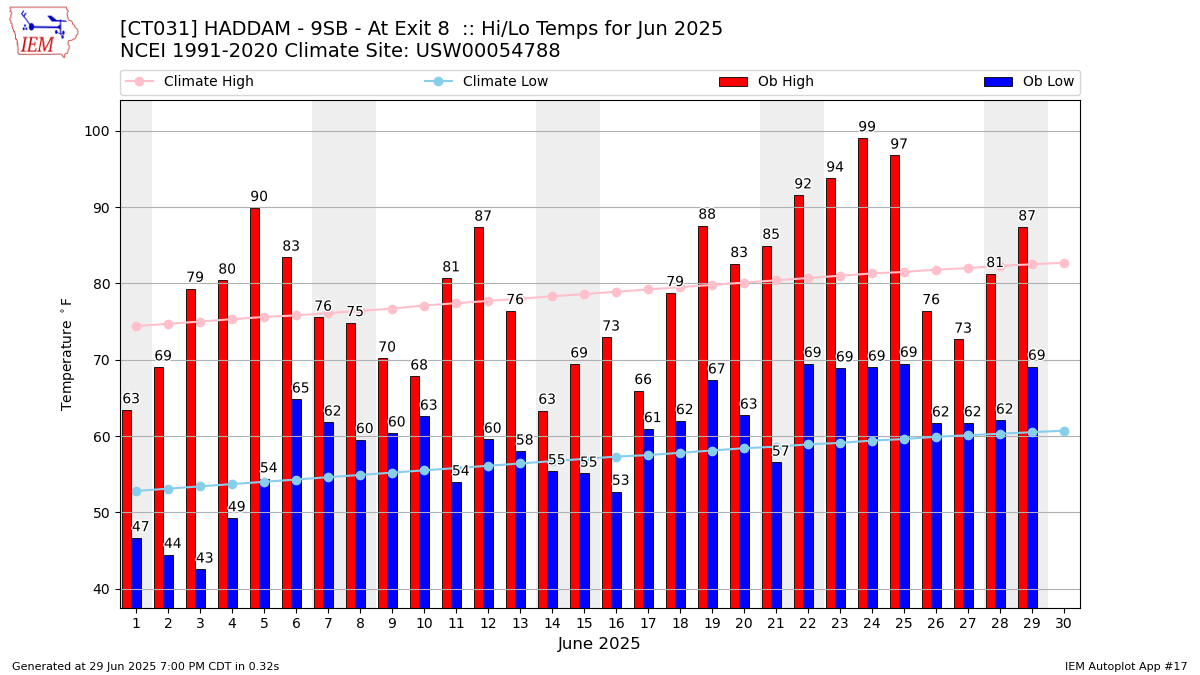
Description: This chart of the monthly temperature data. The bars are the observations and the dots are climatology.
Daily Rainfall
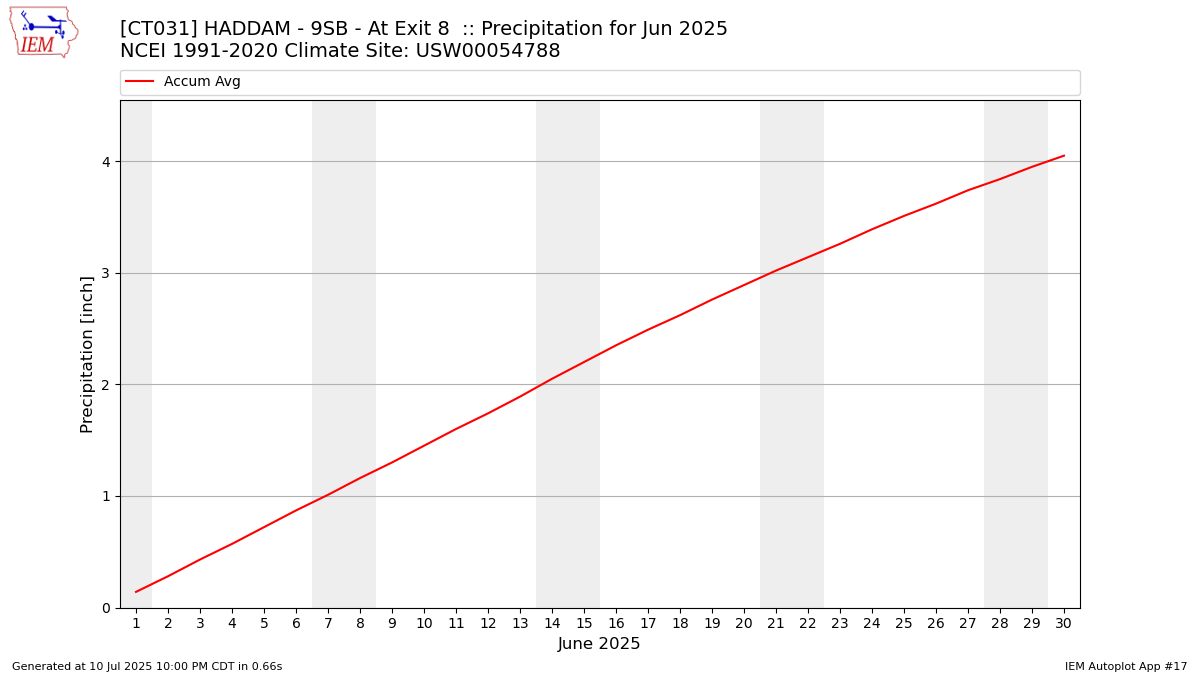
Description: This chart is of daily precipitation for the month. The red line would be an average month while the blue line and bars are observations.
Daily Average Wind Speeds

Description: This chart is of the daily average wind speeds.
The data presented here provided by IEM API webservice: daily.json. A simple CSV option exists as well.