| May 2025 | Jun 2025 | Jul 2025 | ||||
|---|---|---|---|---|---|---|
| Sunday | Monday | Tuesday | Wednesday | Thursday | Friday | Saturday |
| 01 Precip: M Max Stage[ft]: 0.96 | 02 Precip: M Max Stage[ft]: 0.95 | 03 Precip: M Max Stage[ft]: 0.97 | 04 Precip: M Max Stage[ft]: 4.41 | 05 Precip: M Max Stage[ft]: 4.37 | 06 Precip: M Max Stage[ft]: 0.98 | 07 Precip: M Max Stage[ft]: 0.92 |
| 08 Precip: M Max Stage[ft]: 0.83 | 09 Precip: M Max Stage[ft]: 0.77 | 10 Precip: M Max Stage[ft]: 0.71 | 11 Precip: M Max Stage[ft]: 0.72 | 12 Precip: M Max Stage[ft]: 0.64 | 13 Precip: M Max Stage[ft]: 0.62 | 14 Precip: M Max Stage[ft]: 0.67 |
| 15 Precip: M Max Stage[ft]: 0.77 | 16 Precip: M Max Stage[ft]: 0.73 | 17 Precip: M Max Stage[ft]: 3.98 | 18 Precip: M Max Stage[ft]: 0.60 | 19 Precip: M Max Stage[ft]: 0.59 | 20 Precip: M Max Stage[ft]: 0.59 | 21 Precip: M Max Stage[ft]: 0.65 |
| 22 Precip: M Max Stage[ft]: 0.65 | 23 Precip: M Max Stage[ft]: 0.66 | 24 Precip: M Max Stage[ft]: 0.68 | 25 Precip: M Max Stage[ft]: 0.67 | 26 Precip: M Max Stage[ft]: 4.05 | 27 Precip: M Max Stage[ft]: 0.69 | 28 Precip: M |
| 29 | 30 | 01 | 02 | 03 | 04 | 05 |
The data presented here provided by IEM API webservice: daily.json. A simple CSV option exists as well.
Daily High/Low Plot
Description: This chart of the monthly temperature data. The bars are the observations and the dots are climatology.
Daily Rainfall
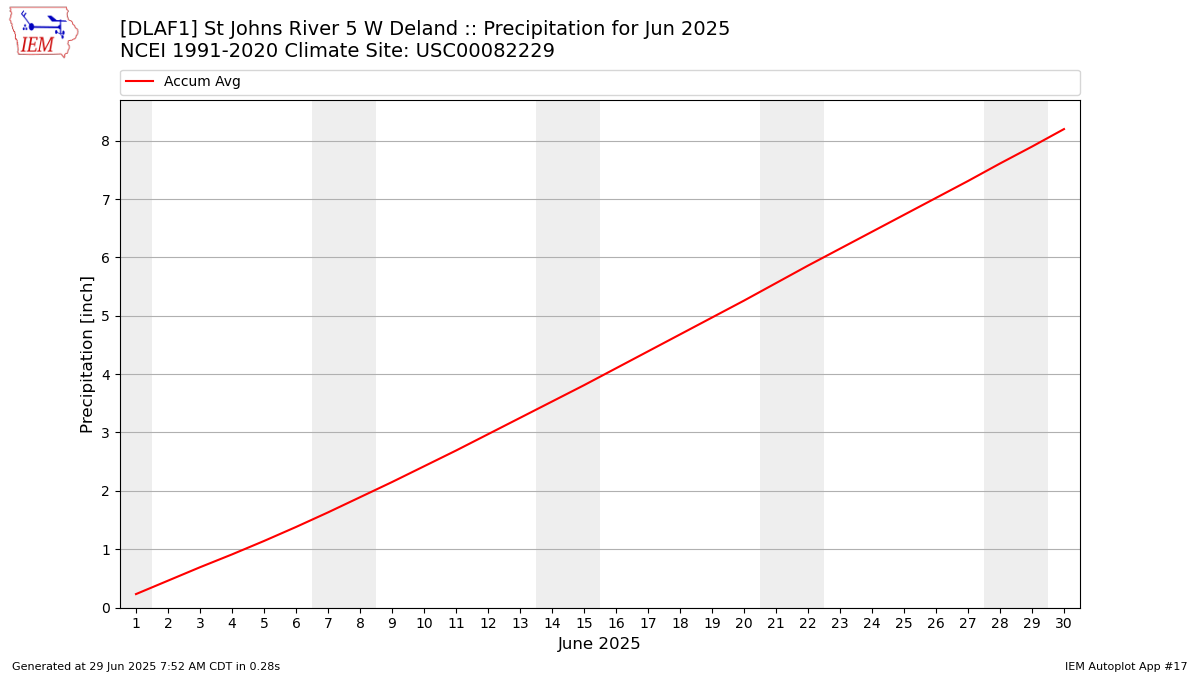
Description: This chart is of daily precipitation for the month. The red line would be an average month while the blue line and bars are observations.
Daily Average Wind Speeds
Description: This chart is of the daily average wind speeds.
The data presented here provided by IEM API webservice: daily.json. A simple CSV option exists as well.