| May 2025 | Jun 2025 | Jul 2025 | ||||
|---|---|---|---|---|---|---|
| Sunday | Monday | Tuesday | Wednesday | Thursday | Friday | Saturday |
| 01 High: 69.609215 Low: 45.820404 Precip: M Avg Wind: WNW @ 2.5 Gust: 20 (12:59 PM) RH% Min/Max: 41-90 Feel Min/Max: 46 to 70 | 02 High: 75.819176 Low: 45.159798 Precip: M Avg Wind: N @ 3.0 Gust: 21 (10:10 AM) RH% Min/Max: 29-96 Feel Min/Max: 44 to 76 | 03 High: 82.58 Low: 50.379787 Precip: M Avg Wind: ENE @ 2.5 Gust: 16 (5:20 PM) RH% Min/Max: 34-93 Feel Min/Max: 50 to 82 | 04 High: 86.219604 Low: 54.210224 Precip: M Avg Wind: SE @ 3.2 Gust: 19 (5:00 PM) RH% Min/Max: 50-92 Feel Min/Max: 54 to 90 | 05 High: 86.39962 Low: 63.759212 Precip: M Avg Wind: SE @ 3.2 Gust: 19 (6:30 PM) RH% Min/Max: 55-97 Feel Min/Max: 64 to 92 | 06 High: 86.64983 Low: 64.4792 Precip: M Avg Wind: SE @ 2.9 Gust: 20 (4:59 PM) RH% Min/Max: 50-98 Feel Min/Max: 64 to 90 | 07 High: 85.04061 Low: 67.350204 Precip: M Avg Wind: N @ 3.0 Gust: 16 (6:00 PM) RH% Min/Max: 57-100 Feel Min/Max: 67 to 89 |
| 08 High: 73.81939 Low: 65.949776 Precip: M Avg Wind: E @ 3.9 Gust: 20 (11:19 AM) RH% Min/Max: 74-96 Feel Min/Max: 66 to 74 | 09 High: 81.750206 Low: 65.5106 Precip: M Avg Wind: E @ 3.8 Gust: 16 (12:00 AM) RH% Min/Max: 65-100 Feel Min/Max: 66 to 85 | 10 High: 84.869606 Low: 68.54002 Precip: M Avg Wind: NNE @ 3.4 Gust: 15 (11:49 AM) RH% Min/Max: 44-100 Feel Min/Max: 69 to 85 | 11 High: 85.67963 Low: 62.70079 Precip: M Avg Wind: NNW @ 2.6 Gust: 15 (4:10 PM) RH% Min/Max: 40-92 Feel Min/Max: 63 to 85 | 12 High: 91.509796 Low: 62.180588 Precip: M Avg Wind: N @ 2.8 Gust: 14 (12:00 PM) RH% Min/Max: 40-95 Feel Min/Max: 62 to 95 | 13 High: 88.41918 Low: 67.56982 Precip: M Avg Wind: ENE @ 3.9 Gust: 18 (3:39 PM) RH% Min/Max: 51-93 Feel Min/Max: 68 to 95 | 14 High: 83.19919 Low: 66.979416 Precip: M Avg Wind: NE @ 4.4 Gust: 15 (7:00 PM) RH% Min/Max: 64-98 Feel Min/Max: 67 to 88 |
| 15 High: 66.61939 Low: 60.569607 Precip: M Avg Wind: ENE @ 4.3 Gust: 14 (3:40 AM) RH% Min/Max: 93-100 Feel Min/Max: 61 to 67 | 16 High: 65.67979 Low: 60.06918 Precip: M Avg Wind: NE @ 4.0 Gust: 13 (6:49 AM) RH% Min/Max: 100-100 Feel Min/Max: 60 to 66 | 17 High: 74.66001 Low: 64.95079 Precip: M Gust: 13 (9:50 AM) RH% Min/Max: 88-100 Feel Min/Max: 65 to 75 | 18 Precip: M | 19 Precip: M | 20 | 21 |
| 22 | 23 | 24 | 25 | 26 | 27 | 28 |
| 29 | 30 | 01 | 02 | 03 | 04 | 05 |
The data presented here provided by IEM API webservice: daily.json. A simple CSV option exists as well.
Daily High/Low Plot
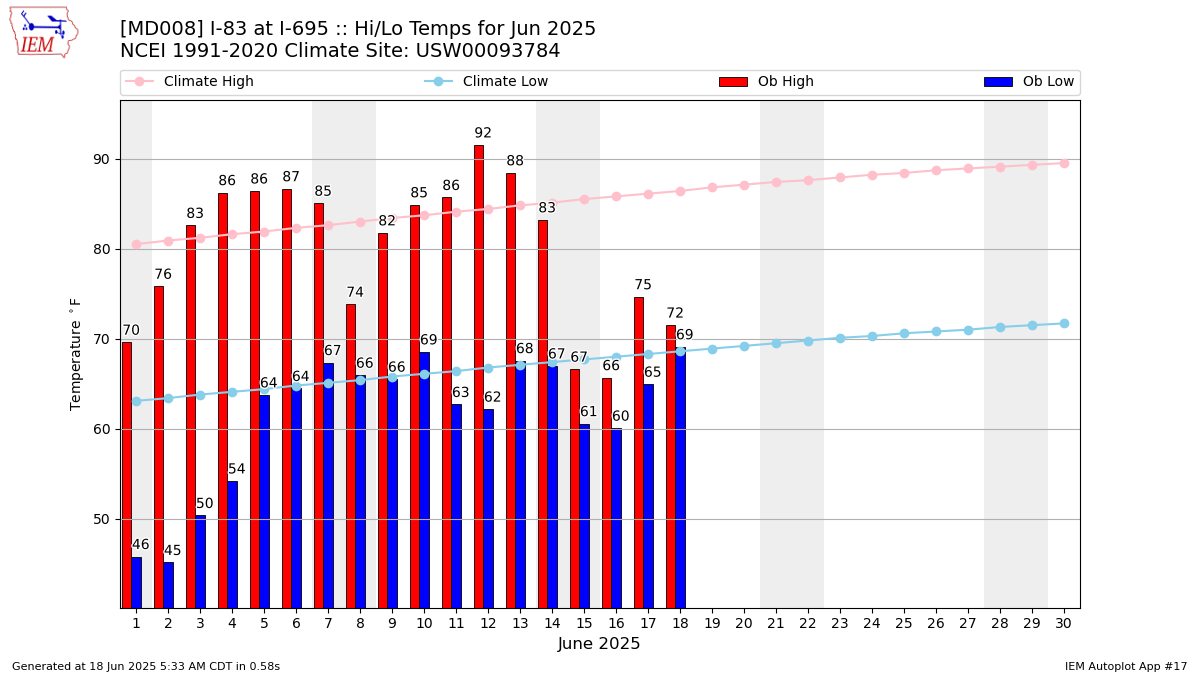
Description: This chart of the monthly temperature data. The bars are the observations and the dots are climatology.
Daily Rainfall
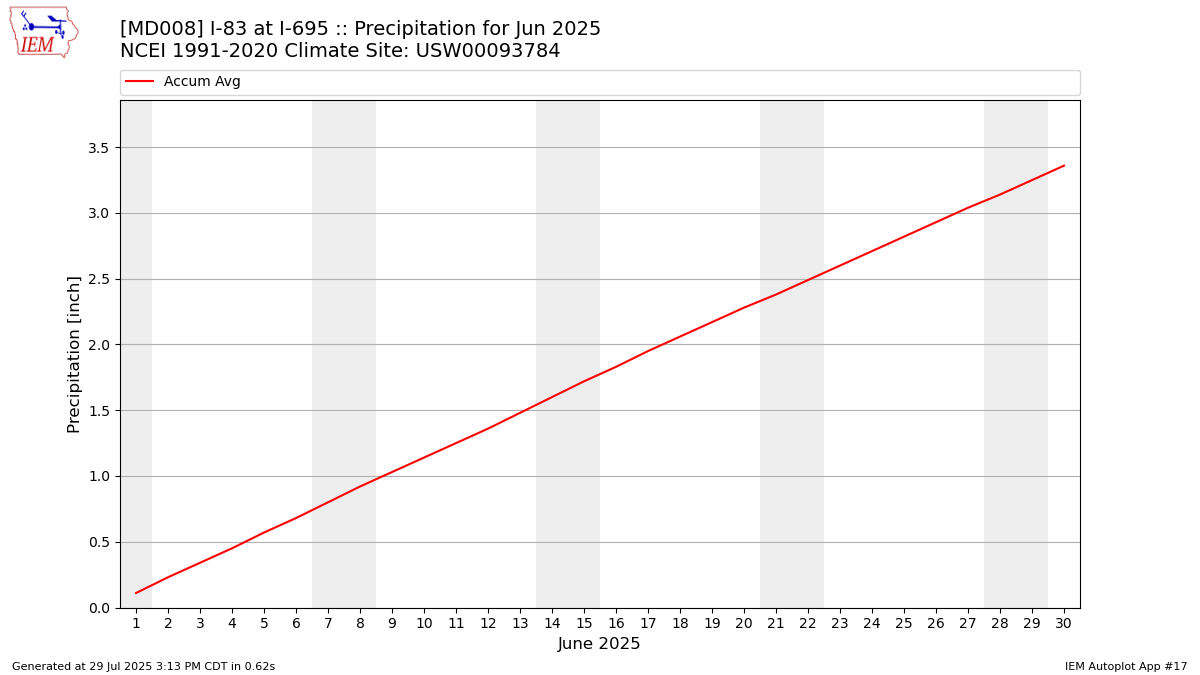
Description: This chart is of daily precipitation for the month. The red line would be an average month while the blue line and bars are observations.
Daily Average Wind Speeds

Description: This chart is of the daily average wind speeds.
The data presented here provided by IEM API webservice: daily.json. A simple CSV option exists as well.