| May 2025 | Jun 2025 | Jul 2025 | ||||
|---|---|---|---|---|---|---|
| Sunday | Monday | Tuesday | Wednesday | Thursday | Friday | Saturday |
| 01 High: 67.38981 Low: 43.199615 Precip: M Avg Wind: S @ 2.4 Gust: 14 (2:19 PM) RH% Min/Max: 47-99 Feel Min/Max: 43 to 67 | 02 High: 74.76982 Low: 47.670776 Precip: M Avg Wind: N @ 2.9 Gust: 20 (12:50 PM) RH% Min/Max: 35-91 Feel Min/Max: 46 to 75 | 03 High: 78.99082 Low: 54.820404 Precip: M Avg Wind: SSE @ 2.5 Gust: 19 (1:29 PM) RH% Min/Max: 45-81 Feel Min/Max: 55 to 79 | 04 High: 88.7792 Low: 60.74061 Precip: M Avg Wind: S @ 2.4 Gust: 13 (6:19 PM) RH% Min/Max: 55-91 Feel Min/Max: 61 to 95 | 05 High: 86.77941 Low: 66.869606 Precip: M Avg Wind: S @ 1.9 Gust: 16 (11:59 PM) RH% Min/Max: 61-97 Feel Min/Max: 67 to 95 | 06 High: 81.01038 Low: 66.180214 Precip: M Avg Wind: NNW @ 1.9 Gust: 14 (12:39 AM) RH% Min/Max: 78-100 Feel Min/Max: 66 to 87 | 07 High: 82.04002 Low: 65.85079 Precip: M Avg Wind: SSW @ 2.2 Gust: 11 (4:39 AM) RH% Min/Max: 74-100 Feel Min/Max: 66 to 89 |
| 08 High: 69.119606 Low: 62.52078 Precip: M Avg Wind: N @ 1.6 Gust: 9 (3:59 AM) RH% Min/Max: 76-100 Feel Min/Max: 63 to 69 | 09 High: 81.21918 Low: 64.34061 Precip: M Avg Wind: S @ 2.9 Gust: 15 (2:19 PM) RH% Min/Max: 79-100 Feel Min/Max: 64 to 88 | 10 High: 81.01038 Low: 63.350574 Precip: M Avg Wind: SSW @ 2.1 Gust: 15 (12:09 PM) RH% Min/Max: 63-100 Feel Min/Max: 63 to 84 | 11 High: 81.62963 Low: 60.589382 Precip: M Avg Wind: SSW @ 2.7 Gust: 16 (11:39 AM) RH% Min/Max: 54-100 Feel Min/Max: 61 to 84 | 12 High: 86.77941 Low: 63.190395 Precip: M Avg Wind: SW @ 2.5 Gust: 13 (8:59 AM) RH% Min/Max: 55-99 Feel Min/Max: 63 to 94 | 13 High: 80.00063 Low: 68.419395 Precip: M Avg Wind: N @ 1.7 Gust: 12 (5:19 PM) RH% Min/Max: 76-100 Feel Min/Max: 68 to 84 | 14 High: 77.81001 Low: 66.36022 Precip: M Gust: 9 (5:59 PM) RH% Min/Max: 88-100 Feel Min/Max: 66 to 78 |
| 15 Precip: M | 16 | 17 | 18 | 19 | 20 | 21 |
| 22 | 23 | 24 | 25 | 26 | 27 | 28 |
| 29 | 30 | 01 | 02 | 03 | 04 | 05 |
The data presented here provided by IEM API webservice: daily.json. A simple CSV option exists as well.
Daily High/Low Plot
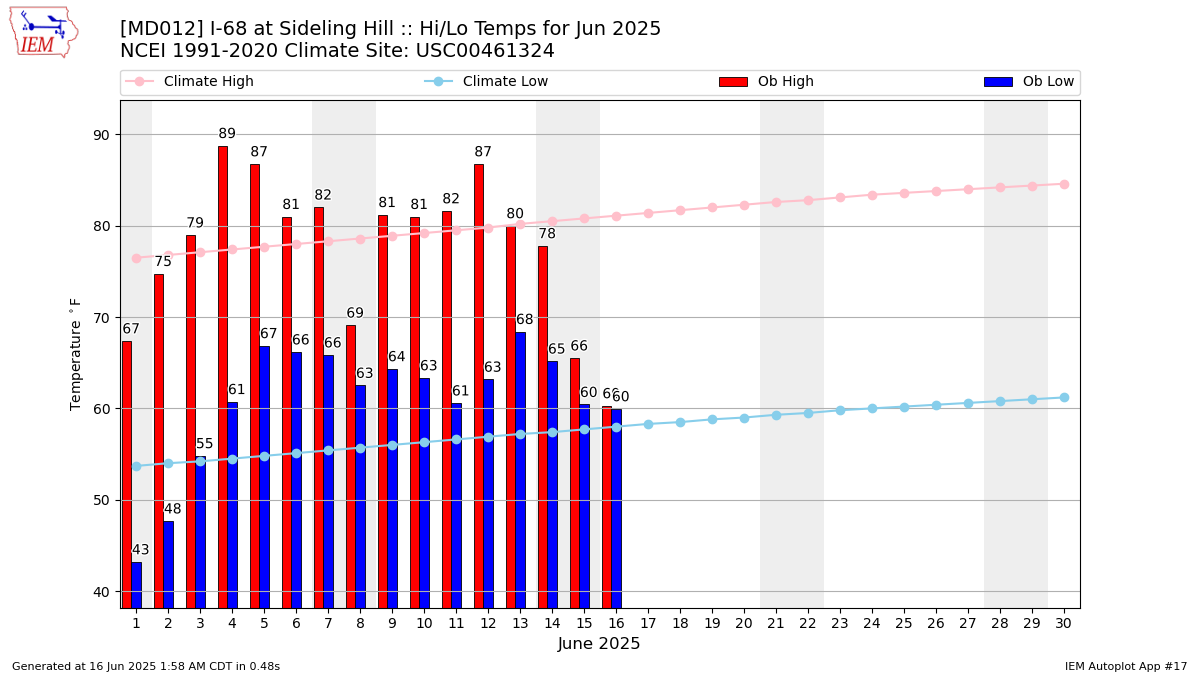
Description: This chart of the monthly temperature data. The bars are the observations and the dots are climatology.
Daily Rainfall
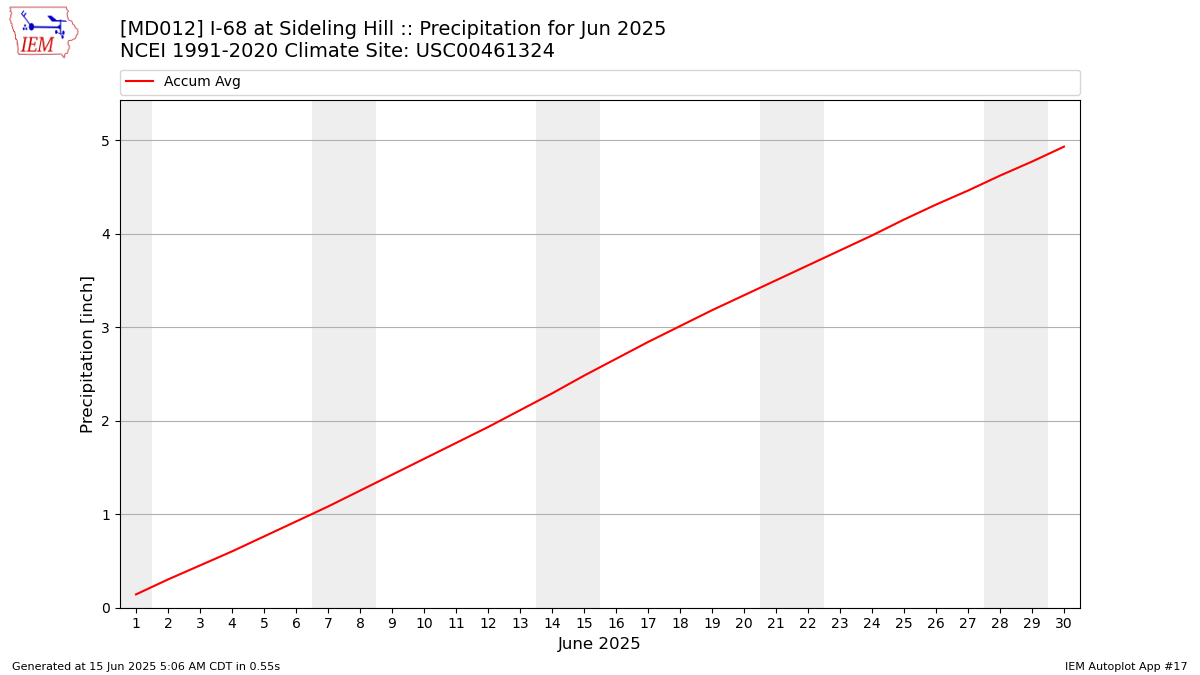
Description: This chart is of daily precipitation for the month. The red line would be an average month while the blue line and bars are observations.
Daily Average Wind Speeds
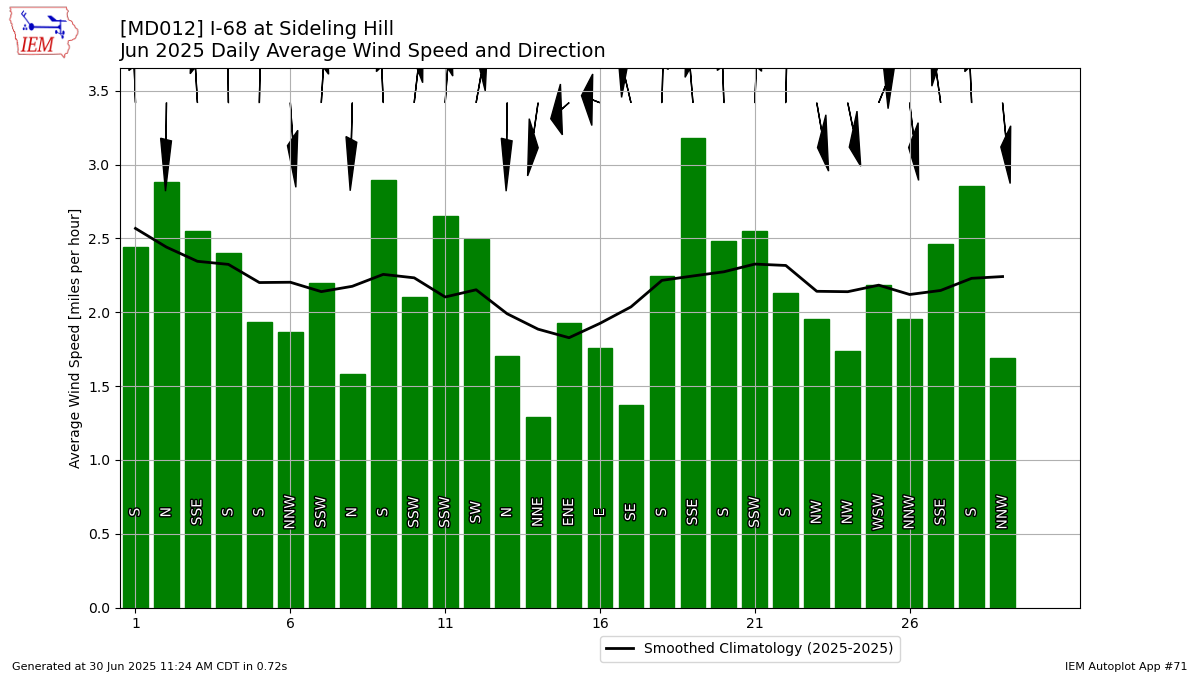
Description: This chart is of the daily average wind speeds.
The data presented here provided by IEM API webservice: daily.json. A simple CSV option exists as well.