| May 2025 | Jun 2025 | Jul 2025 | ||||
|---|---|---|---|---|---|---|
| Sunday | Monday | Tuesday | Wednesday | Thursday | Friday | Saturday |
| 01 High: 70.9808 Low: 48.520405 Precip: M Avg Wind: W @ 6.9 Gust: 25 (2:09 PM) RH% Min/Max: 39-74 Feel Min/Max: 46 to 71 | 02 High: 77.320404 Low: 49.060383 Precip: M Avg Wind: WNW @ 4.6 Gust: 18 (3:59 PM) RH% Min/Max: 28-83 Feel Min/Max: 47 to 77 | 03 High: 82.5494 Low: 54.699776 Precip: M Avg Wind: SSW @ 4.2 Gust: 16 (3:19 PM) RH% Min/Max: 30-74 Feel Min/Max: 55 to 81 | 04 High: 87.1808 Low: 56.569977 Precip: M Avg Wind: S @ 5.3 Gust: 23 (3:29 PM) RH% Min/Max: 44-85 Feel Min/Max: 57 to 89 | 05 High: 86.250206 Low: 66.95058 Precip: M Avg Wind: S @ 5.5 Gust: 18 (5:29 PM) RH% Min/Max: 54-84 Feel Min/Max: 67 to 91 | 06 High: 86.91982 Low: 64.079575 Precip: M Avg Wind: SSE @ 4.3 Gust: 23 (2:49 PM) RH% Min/Max: 48-93 Feel Min/Max: 64 to 90 | 07 High: 86.86038 Low: 69.0494 Precip: M Avg Wind: NW @ 3.2 Gust: 15 (6:29 PM) RH% Min/Max: 54-95 Feel Min/Max: 69 to 91 |
| 08 High: 75.52941 Low: 67.62019 Precip: M Avg Wind: E @ 6.3 Gust: 23 (8:49 PM) RH% Min/Max: 71-92 Feel Min/Max: 68 to 76 | 09 High: 83.74999 Low: 66.99919 Precip: M Avg Wind: ESE @ 5.0 Gust: 15 (4:39 PM) RH% Min/Max: 55-95 Feel Min/Max: 67 to 87 | 10 High: 87.229416 Low: 68.55079 Precip: M Avg Wind: WNW @ 5.8 Gust: 23 (4:09 PM) RH% Min/Max: 38-93 Feel Min/Max: 69 to 87 | 11 High: 86.70921 Low: 64.940025 Precip: M Avg Wind: WSW @ 4.2 Gust: 17 (2:29 PM) RH% Min/Max: 39-94 Feel Min/Max: 65 to 87 | 12 High: 92.62942 Low: 66.70937 Precip: M Avg Wind: WSW @ 4.8 Gust: 23 (1:59 PM) RH% Min/Max: 36-90 Feel Min/Max: 67 to 96 | 13 High: 89.9204 Low: 70.17979 Precip: M Avg Wind: E @ 4.7 Gust: 19 (2:39 PM) RH% Min/Max: 56-94 Feel Min/Max: 70 to 98 | 14 High: 84.180214 Low: 69.78021 Precip: M Avg Wind: ENE @ 5.0 Gust: 20 (5:49 PM) RH% Min/Max: 66-95 Feel Min/Max: 70 to 90 |
| 15 High: 69.24919 Low: 62.470406 Precip: M Avg Wind: ENE @ 6.7 Gust: 17 (12:39 AM) RH% Min/Max: 86-96 Feel Min/Max: 62 to 69 | 16 High: 67.09999 Low: 61.71982 Precip: M Avg Wind: ENE @ 4.8 Gust: 16 (12:39 AM) RH% Min/Max: 95-97 Feel Min/Max: 62 to 67 | 17 High: 72.24978 Low: 65.71038 Precip: M Gust: 11 (10:39 AM) RH% Min/Max: 89-97 Feel Min/Max: 66 to 72 | 18 Precip: M | 19 | 20 | 21 |
| 22 | 23 | 24 | 25 | 26 | 27 | 28 |
| 29 | 30 | 01 | 02 | 03 | 04 | 05 |
The data presented here provided by IEM API webservice: daily.json. A simple CSV option exists as well.
Daily High/Low Plot

Description: This chart of the monthly temperature data. The bars are the observations and the dots are climatology.
Daily Rainfall
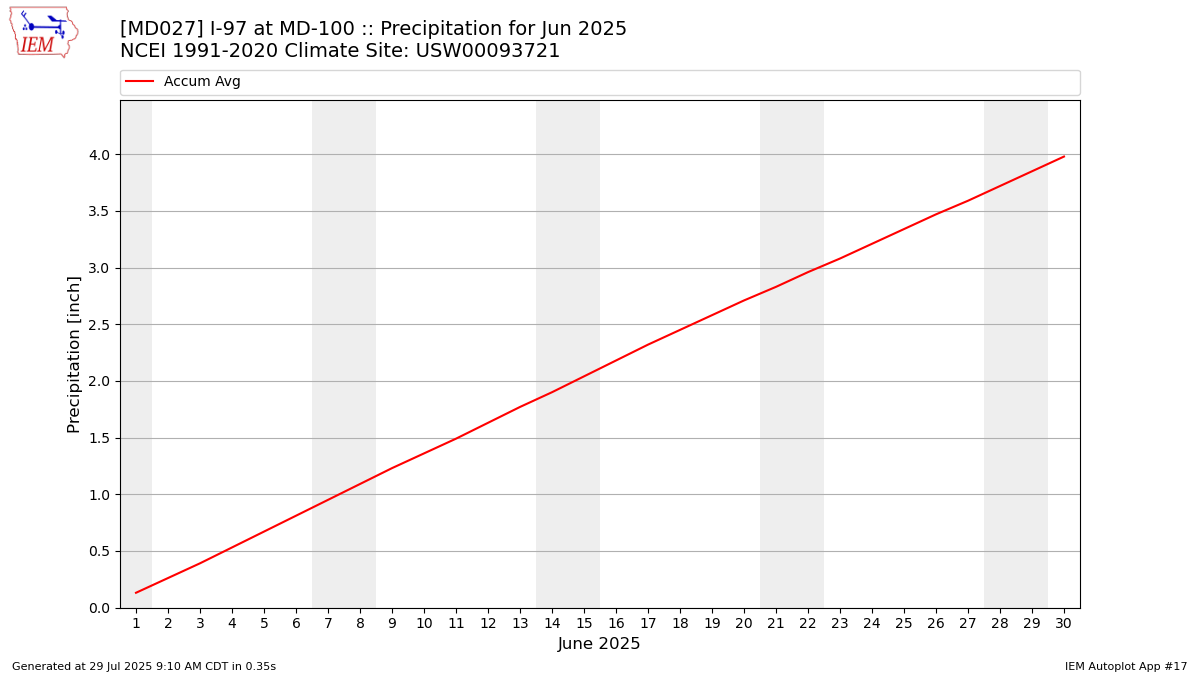
Description: This chart is of daily precipitation for the month. The red line would be an average month while the blue line and bars are observations.
Daily Average Wind Speeds
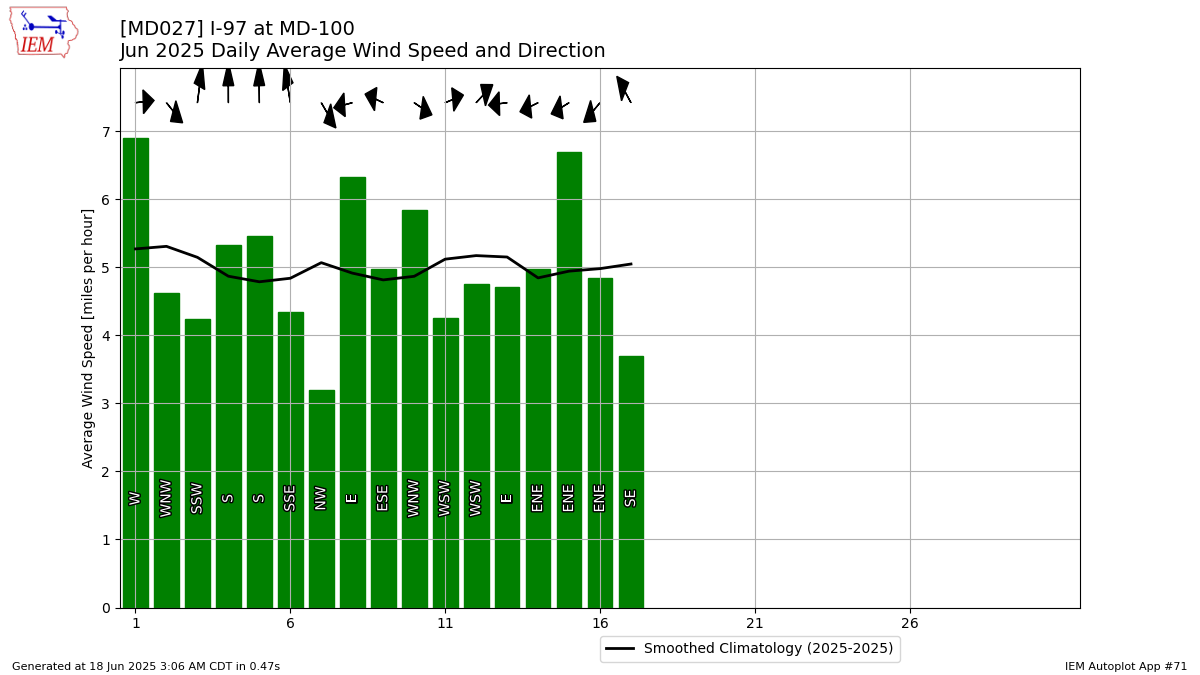
Description: This chart is of the daily average wind speeds.
The data presented here provided by IEM API webservice: daily.json. A simple CSV option exists as well.