| May 2025 | Jun 2025 | Jul 2025 | ||||
|---|---|---|---|---|---|---|
| Sunday | Monday | Tuesday | Wednesday | Thursday | Friday | Saturday |
| 01 High: 69.24919 Low: 49.11081 Precip: M Avg Wind: W @ 4.5 Gust: 25 (12:50 PM) RH% Min/Max: 41-86 Feel Min/Max: 48 to 69 | 02 High: 73.68981 Low: 50.28981 Precip: M Avg Wind: NNW @ 3.5 Gust: 17 (2:29 PM) RH% Min/Max: 31-92 Feel Min/Max: 50 to 74 | 03 High: 81.640396 Low: 51.799988 Precip: M Avg Wind: WNW @ 2.5 Gust: 13 (12:50 PM) RH% Min/Max: 37-89 Feel Min/Max: 52 to 81 | 04 High: 83.49978 Low: 58.249405 Precip: M Avg Wind: S @ 4.6 Gust: 22 (5:00 PM) RH% Min/Max: 47-85 Feel Min/Max: 58 to 85 | 05 High: 79.75942 Low: 63.820404 Precip: M Avg Wind: SSW @ 3.7 Gust: 15 (9:59 AM) RH% Min/Max: 62-92 Feel Min/Max: 64 to 80 | 06 High: 73.14983 Low: 65.5502 Precip: M Avg Wind: SE @ 2.6 Gust: 13 (6:09 PM) RH% Min/Max: 88-95 Feel Min/Max: 66 to 73 | 07 High: 80.790825 Low: 67.3808 Precip: M Avg Wind: N @ 2.8 Gust: 17 (2:00 PM) RH% Min/Max: 67-98 Feel Min/Max: 67 to 85 |
| 08 High: 78.920616 Low: 65.690605 Precip: M Avg Wind: ENE @ 3.2 Gust: 14 (5:00 PM) RH% Min/Max: 70-95 Feel Min/Max: 66 to 79 | 09 High: 82.25958 Low: 65.859795 Precip: M Avg Wind: ENE @ 4.3 Gust: 20 (6:10 PM) RH% Min/Max: 66-97 Feel Min/Max: 66 to 87 | 10 High: 84.29002 Low: 68.88021 Precip: M Avg Wind: SW @ 3.5 Gust: 20 (10:49 AM) RH% Min/Max: 54-95 Feel Min/Max: 69 to 87 | 11 High: 86.160225 Low: 65.87062 Precip: M Avg Wind: NW @ 3.1 Gust: 15 (4:10 PM) RH% Min/Max: 43-94 Feel Min/Max: 66 to 87 | 12 High: 89.1896 Low: 66.779625 Precip: M Avg Wind: WSW @ 3.2 Gust: 20 (3:40 PM) RH% Min/Max: 45-95 Feel Min/Max: 67 to 94 | 13 High: 88.73058 Low: 69.5606 Precip: M Avg Wind: SSE @ 2.6 Gust: 21 (1:30 PM) RH% Min/Max: 57-93 Feel Min/Max: 70 to 96 | 14 High: 85.350204 Low: 64.799614 Precip: M Avg Wind: ENE @ 3.2 Gust: 15 (9:10 PM) RH% Min/Max: 69-96 Feel Min/Max: 65 to 93 |
| 15 High: 72.53059 Low: 62.83037 Precip: M Avg Wind: ENE @ 3.4 Gust: 19 (12:49 AM) RH% Min/Max: 79-93 Feel Min/Max: 63 to 73 | 16 High: 72.68 Low: 63.480213 Precip: M Avg Wind: ENE @ 3.4 Gust: 14 (4:00 PM) RH% Min/Max: 80-95 Feel Min/Max: 63 to 73 | 17 High: 64.95079 Low: 64.13 Precip: M Gust: 8 (5:20 AM) RH% Min/Max: 93-94 Feel Min/Max: 64 to 65 | 18 Precip: M | 19 | 20 | 21 |
| 22 | 23 | 24 | 25 | 26 | 27 | 28 |
| 29 | 30 | 01 | 02 | 03 | 04 | 05 |
The data presented here provided by IEM API webservice: daily.json. A simple CSV option exists as well.
Daily High/Low Plot
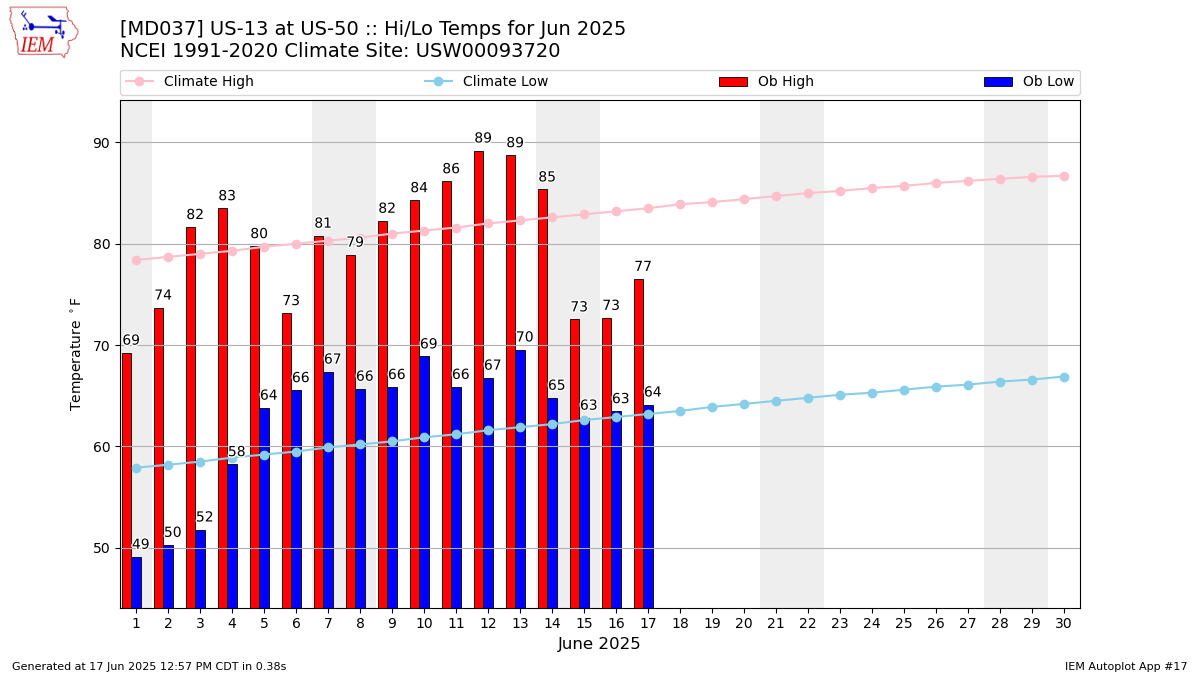
Description: This chart of the monthly temperature data. The bars are the observations and the dots are climatology.
Daily Rainfall
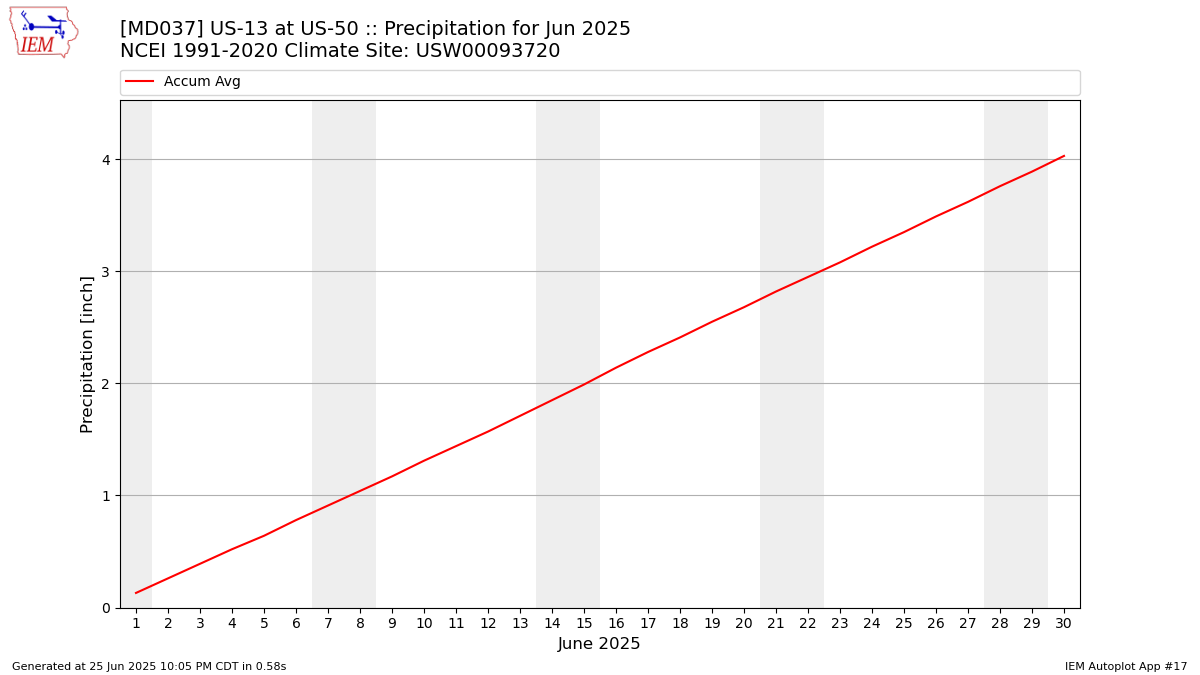
Description: This chart is of daily precipitation for the month. The red line would be an average month while the blue line and bars are observations.
Daily Average Wind Speeds
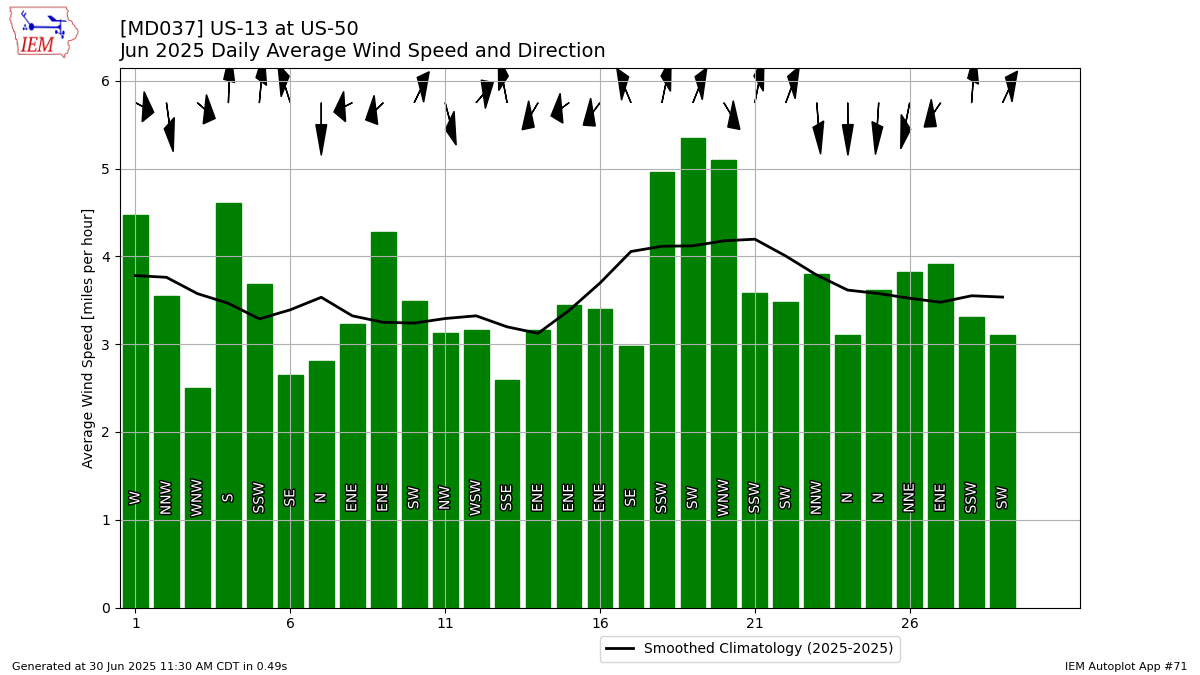
Description: This chart is of the daily average wind speeds.
The data presented here provided by IEM API webservice: daily.json. A simple CSV option exists as well.