| May 2025 | Jun 2025 | Jul 2025 | ||||
|---|---|---|---|---|---|---|
| Sunday | Monday | Tuesday | Wednesday | Thursday | Friday | Saturday |
| 01 High: 67.58059 Low: 46.59082 Precip: M Avg Wind: WNW @ 3.7 Gust: 22 (12:20 PM) RH% Min/Max: 43-83 Feel Min/Max: 47 to 68 | 02 High: 73.25958 Low: 50.46982 Precip: M Avg Wind: NW @ 2.4 Gust: 15 (11:20 AM) RH% Min/Max: 31-72 Feel Min/Max: 50 to 73 | 03 High: 80.38938 Low: 59.439224 Precip: M Avg Wind: WNW @ 1.6 Gust: 10 (3:50 AM) RH% Min/Max: 32-63 Feel Min/Max: 59 to 80 | 04 High: 84.3494 Low: 58.260223 Precip: M Avg Wind: SSW @ 1.4 Gust: 11 (5:40 PM) RH% Min/Max: 54-95 Feel Min/Max: 58 to 87 | 05 High: 84.12078 Low: 63.449615 Precip: M Avg Wind: SSW @ 1.4 Gust: 13 (6:10 PM) RH% Min/Max: 62-100 Feel Min/Max: 63 to 90 | 06 High: 85.089226 Low: 64.999405 Precip: M Avg Wind: SSW @ 1.1 Gust: 9 (3:40 PM) RH% Min/Max: 52-100 Feel Min/Max: 65 to 89 | 07 High: 84.29002 Low: 68.63 Precip: M Avg Wind: NW @ 1.4 Gust: 16 (5:00 PM) RH% Min/Max: 56-100 Feel Min/Max: 69 to 87 |
| 08 High: 72.49999 Low: 64.979576 Precip: M Avg Wind: ESE @ 2.7 Gust: 17 (3:20 PM) RH% Min/Max: 75-100 Feel Min/Max: 65 to 72 | 09 High: 80.419975 Low: 63.699776 Precip: M Avg Wind: ESE @ 2.0 Gust: 15 (12:30 AM) RH% Min/Max: 66-100 Feel Min/Max: 64 to 83 | 10 High: 82.779785 Low: 66.61939 Precip: M Avg Wind: WNW @ 2.4 Gust: 16 (4:20 PM) RH% Min/Max: 46-100 Feel Min/Max: 67 to 84 | 11 High: 83.46918 Low: 65.589806 Precip: M Avg Wind: WNW @ 2.2 Gust: 13 (4:20 PM) RH% Min/Max: 40-80 Feel Min/Max: 66 to 83 | 12 High: 89.13922 Low: 65.84002 Precip: M Avg Wind: WNW @ 2.1 Gust: 15 (3:20 PM) RH% Min/Max: 43-90 Feel Min/Max: 66 to 91 | 13 High: 84.83 Low: 68.66961 Precip: M Avg Wind: ESE @ 2.1 Gust: 13 (3:50 PM) RH% Min/Max: 60-93 Feel Min/Max: 69 to 90 | 14 High: 75.45921 Low: 65.01022 Precip: M Avg Wind: ESE @ 1.9 Gust: 12 (10:40 PM) RH% Min/Max: 73-94 Feel Min/Max: 65 to 75 |
| 15 High: 64.830215 Low: 59.329414 Precip: M Avg Wind: ESE @ 2.6 Gust: 13 (6:10 AM) RH% Min/Max: 93-100 Feel Min/Max: 59 to 65 | 16 High: 65.35943 Low: 59.44999 Precip: M Avg Wind: ESE @ 1.6 Gust: 9 (4:50 PM) RH% Min/Max: 100-100 Feel Min/Max: 59 to 65 | 17 High: 73.9598 Low: 63.879787 Precip: M Avg Wind: ESE @ 1.3 Gust: 7 (6:40 PM) RH% Min/Max: 90-100 Feel Min/Max: 64 to 74 | 18 High: 74.87963 Low: 70.37062 Precip: M Gust: 11 (12:20 AM) RH% Min/Max: 99-100 Feel Min/Max: 70 to 75 | 19 Precip: M | 20 | 21 |
| 22 | 23 | 24 | 25 | 26 | 27 | 28 |
| 29 | 30 | 01 | 02 | 03 | 04 | 05 |
The data presented here provided by IEM API webservice: daily.json. A simple CSV option exists as well.
Daily High/Low Plot
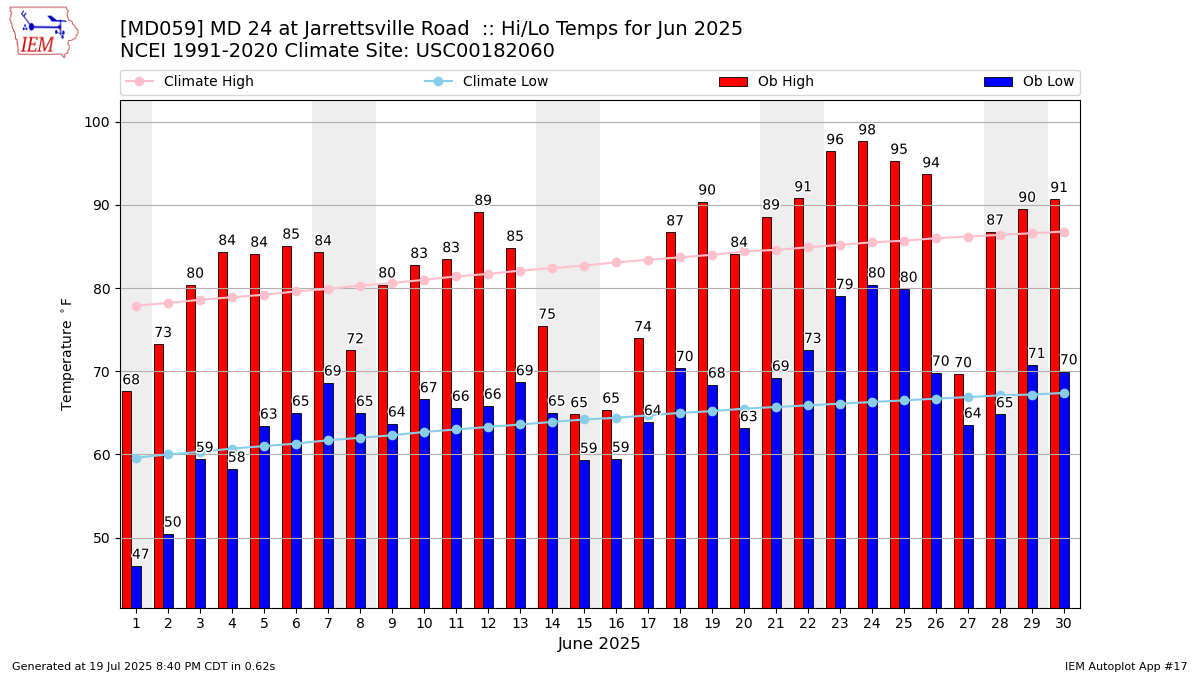
Description: This chart of the monthly temperature data. The bars are the observations and the dots are climatology.
Daily Rainfall
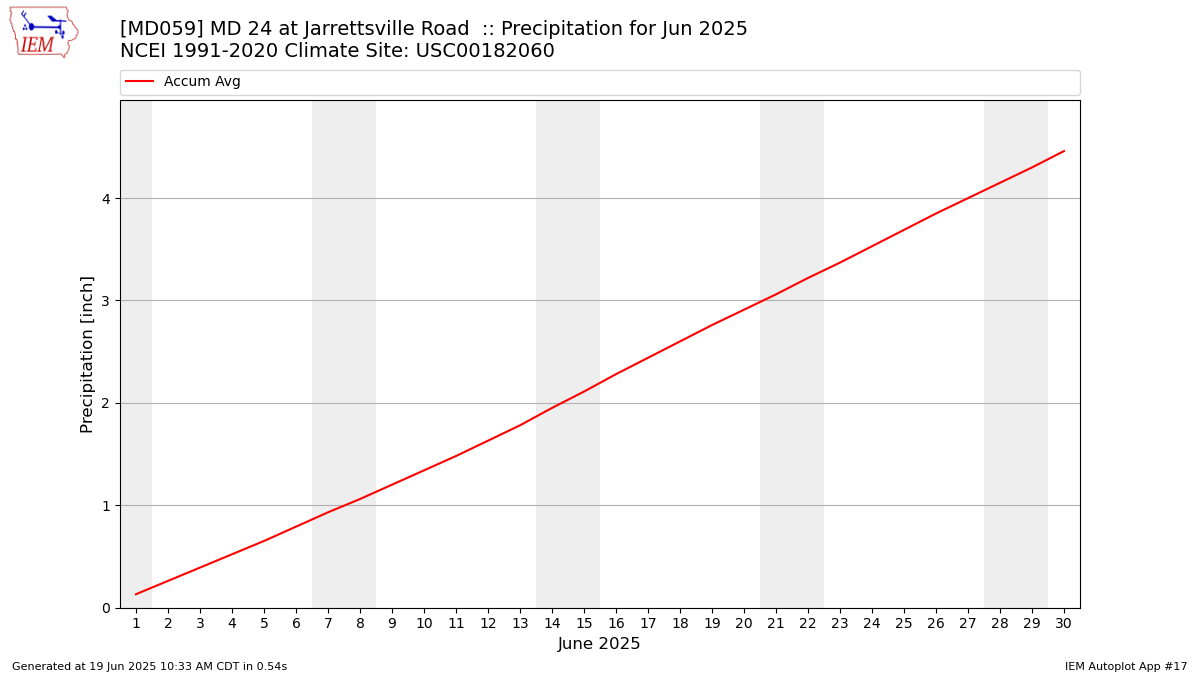
Description: This chart is of daily precipitation for the month. The red line would be an average month while the blue line and bars are observations.
Daily Average Wind Speeds

Description: This chart is of the daily average wind speeds.
The data presented here provided by IEM API webservice: daily.json. A simple CSV option exists as well.