| May 2025 | Jun 2025 | Jul 2025 | ||||
|---|---|---|---|---|---|---|
| Sunday | Monday | Tuesday | Wednesday | Thursday | Friday | Saturday |
| 01 High: 65.55921 Low: 45.089596 Precip: M Avg Wind: W @ 6.8 Gust: 24 (12:19 PM) RH% Min/Max: 43-86 Feel Min/Max: 42 to 66 | 02 High: 73.09039 Low: 40.989223 Precip: M Avg Wind: NW @ 3.6 Gust: 17 (4:19 PM) RH% Min/Max: 33-100 Feel Min/Max: 41 to 73 | 03 High: 79.0808 Low: 48.27019 Precip: M Avg Wind: SSW @ 3.0 Gust: 16 (3:19 PM) RH% Min/Max: 37-96 Feel Min/Max: 48 to 79 | 04 High: 87.34999 Low: 55.2308 Precip: M Avg Wind: SSW @ 5.1 Gust: 18 (2:19 PM) RH% Min/Max: 48-97 Feel Min/Max: 55 to 92 | 05 High: 85.53021 Low: 62.189594 Precip: M Avg Wind: SSW @ 4.0 Gust: 15 (11:40 AM) RH% Min/Max: 52-100 Feel Min/Max: 62 to 89 | 06 High: 81.60079 Low: 65.01022 Precip: M Avg Wind: SSW @ 3.0 Gust: 14 (11:40 AM) RH% Min/Max: 65-100 Feel Min/Max: 65 to 86 | 07 High: 81.78981 Low: 65.530426 Precip: M Avg Wind: NNW @ 3.7 Gust: 16 (5:29 PM) RH% Min/Max: 58-100 Feel Min/Max: 66 to 84 |
| 08 High: 71.20937 Low: 65.890396 Precip: M Avg Wind: NE @ 3.9 Gust: 16 (1:39 PM) RH% Min/Max: 66-100 Feel Min/Max: 66 to 71 | 09 High: 83.17941 Low: 66.54919 Precip: M Avg Wind: SSW @ 4.0 Gust: 19 (9:59 PM) RH% Min/Max: 53-100 Feel Min/Max: 67 to 86 | 10 High: 82.2002 Low: 64.979576 Precip: M Avg Wind: WNW @ 6.4 Gust: 21 (1:59 PM) RH% Min/Max: 46-100 Feel Min/Max: 65 to 83 | 11 High: 82.990395 Low: 56.670776 Precip: M Avg Wind: SW @ 3.8 Gust: 20 (1:59 PM) RH% Min/Max: 42-100 Feel Min/Max: 57 to 83 | 12 High: 88.0106 Low: 61.179787 Precip: M Avg Wind: SW @ 4.0 Gust: 17 (2:29 PM) RH% Min/Max: 47-100 Feel Min/Max: 61 to 90 | 13 High: 83.100204 Low: 66.59962 Precip: M Avg Wind: ENE @ 4.4 Gust: 18 (3:40 PM) RH% Min/Max: 62-97 Feel Min/Max: 67 to 87 | 14 High: 79.75942 Low: 67.20079 Precip: M Avg Wind: NE @ 4.4 Gust: 19 (9:19 PM) RH% Min/Max: 70-100 Feel Min/Max: 67 to 80 |
| 15 High: 71.2994 Low: 62.060013 Precip: M Avg Wind: ENE @ 4.7 Gust: 16 (7:59 PM) RH% Min/Max: 80-100 Feel Min/Max: 62 to 71 | 16 High: 68.46081 Low: 60.569607 Precip: M Avg Wind: NE @ 4.2 Gust: 15 (3:09 AM) RH% Min/Max: 86-100 Feel Min/Max: 61 to 68 | 17 High: 80.729576 Low: 65.109215 Precip: M Gust: 16 (2:29 PM) RH% Min/Max: 75-100 Feel Min/Max: 65 to 85 | 18 Precip: M | 19 | 20 | 21 |
| 22 | 23 | 24 | 25 | 26 | 27 | 28 |
| 29 | 30 | 01 | 02 | 03 | 04 | 05 |
The data presented here provided by IEM API webservice: daily.json. A simple CSV option exists as well.
Daily High/Low Plot
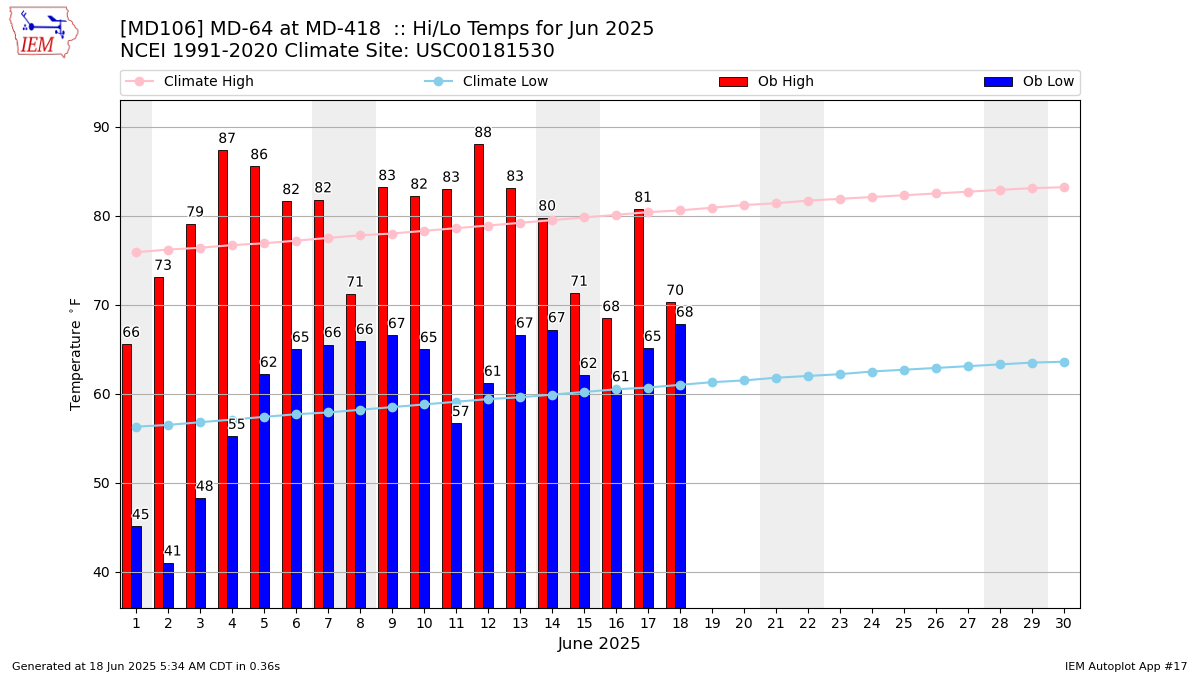
Description: This chart of the monthly temperature data. The bars are the observations and the dots are climatology.
Daily Rainfall
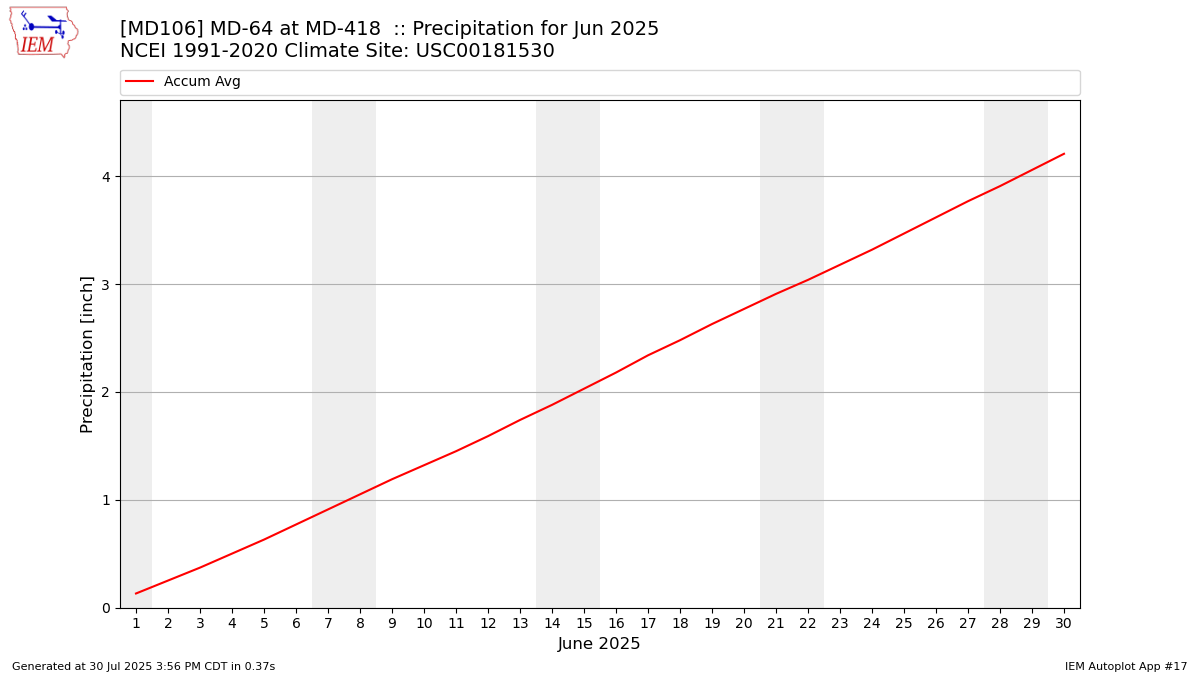
Description: This chart is of daily precipitation for the month. The red line would be an average month while the blue line and bars are observations.
Daily Average Wind Speeds
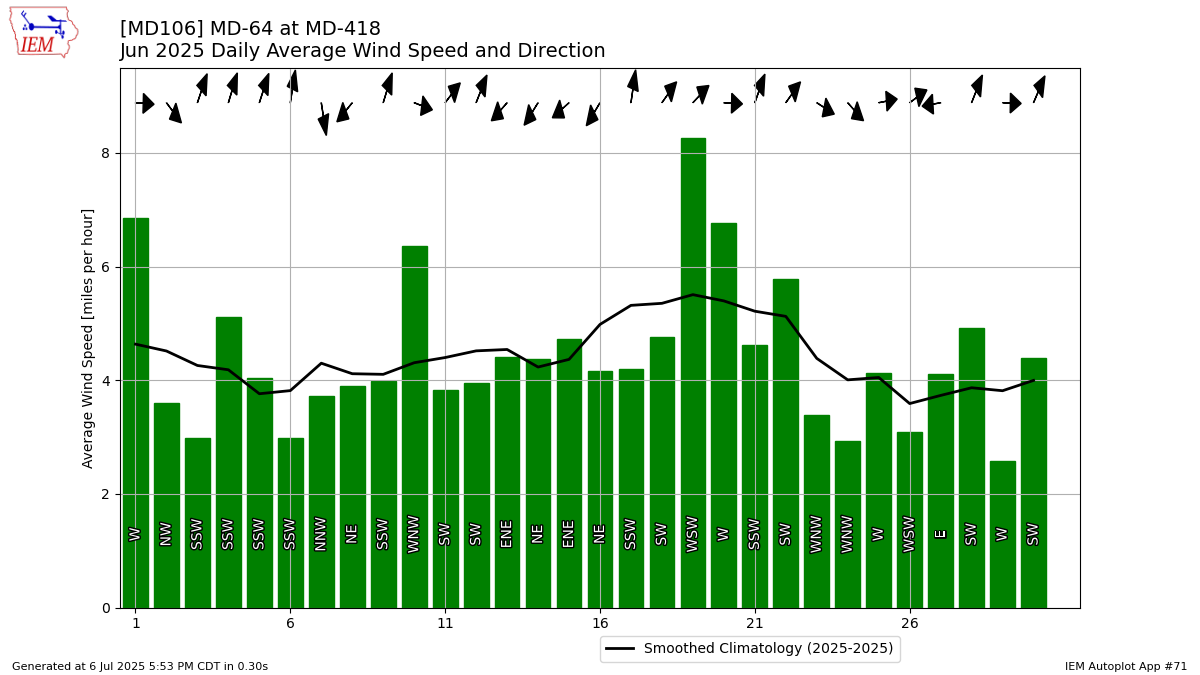
Description: This chart is of the daily average wind speeds.
The data presented here provided by IEM API webservice: daily.json. A simple CSV option exists as well.