| May 2025 | Jun 2025 | Jul 2025 | ||||
|---|---|---|---|---|---|---|
| Sunday | Monday | Tuesday | Wednesday | Thursday | Friday | Saturday |
| 01 High: 59.869392 Low: 39.849777 Precip: M Avg Wind: W @ 5.3 Gust: 24 (11:59 AM) RH% Min/Max: 51-93 Feel Min/Max: 37 to 60 | 02 High: 68.160225 Low: 34.039383 Precip: M Avg Wind: WSW @ 3.3 Gust: 19 (5:09 PM) RH% Min/Max: 32-96 Feel Min/Max: 33 to 68 | 03 High: 81.809586 Low: 39.959583 Precip: M Avg Wind: SE @ 2.8 Gust: 18 (2:39 PM) RH% Min/Max: 29-95 Feel Min/Max: 40 to 81 | 04 High: 83.71038 Low: 49.130585 Precip: M Avg Wind: WSW @ 3.1 Gust: 18 (10:10 AM) RH% Min/Max: 47-96 Feel Min/Max: 49 to 85 | 05 High: 82.27941 Low: 56.350418 Precip: M Avg Wind: W @ 1.8 Gust: 14 (9:29 PM) RH% Min/Max: 46-98 Feel Min/Max: 56 to 83 | 06 High: 76.240395 Low: 57.950577 Precip: M Avg Wind: W @ 2.0 Gust: 17 (10:09 AM) RH% Min/Max: 71-100 Feel Min/Max: 58 to 76 | 07 High: 73.92019 Low: 60.6308 Precip: M Avg Wind: W @ 2.9 Gust: 15 (12:19 PM) RH% Min/Max: 68-99 Feel Min/Max: 61 to 74 |
| 08 High: 69.83059 Low: 59.669605 Precip: M Avg Wind: SSE @ 2.4 Gust: 14 (9:49 AM) RH% Min/Max: 91-99 Feel Min/Max: 60 to 70 | 09 High: 77.48959 Low: 62.029415 Precip: M Avg Wind: WSW @ 4.4 Gust: 19 (8:49 PM) RH% Min/Max: 58-97 Feel Min/Max: 62 to 77 | 10 High: 73.9292 Low: 57.03981 Precip: M Avg Wind: WSW @ 4.4 Gust: 26 (3:09 PM) RH% Min/Max: 59-98 Feel Min/Max: 57 to 74 | 11 High: 77.39061 Low: 50.10079 Precip: M Avg Wind: WSW @ 3.6 Gust: 18 (2:19 PM) RH% Min/Max: 49-98 Feel Min/Max: 50 to 77 | 12 High: 82.86081 Low: 54.559425 Precip: M Avg Wind: W @ 3.1 Gust: 15 (10:10 AM) RH% Min/Max: 46-98 Feel Min/Max: 55 to 84 | 13 High: 80.92941 Low: 58.600418 Precip: M Avg Wind: SE @ 1.7 Gust: 11 (7:19 PM) RH% Min/Max: 62-98 Feel Min/Max: 59 to 83 | 14 High: 76.74978 Low: 64.84999 Precip: M Avg Wind: WSW @ 2.8 Gust: 17 (6:09 PM) RH% Min/Max: 74-100 Feel Min/Max: 65 to 77 |
| 15 High: 74.60958 Low: 61.930428 Precip: M Gust: 15 (1:39 PM) RH% Min/Max: 77-100 Feel Min/Max: 62 to 75 | 16 Precip: M | 17 | 18 | 19 | 20 | 21 |
| 22 | 23 | 24 | 25 | 26 | 27 | 28 |
| 29 | 30 | 01 | 02 | 03 | 04 | 05 |
The data presented here provided by IEM API webservice: daily.json. A simple CSV option exists as well.
Daily High/Low Plot
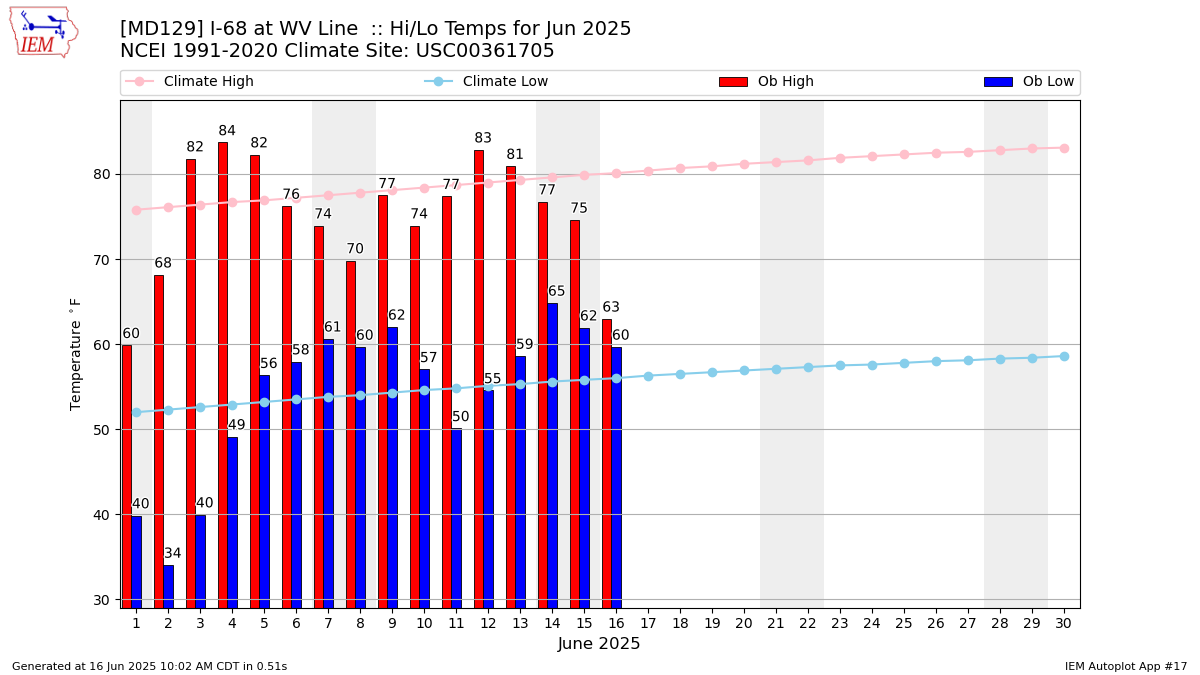
Description: This chart of the monthly temperature data. The bars are the observations and the dots are climatology.
Daily Rainfall
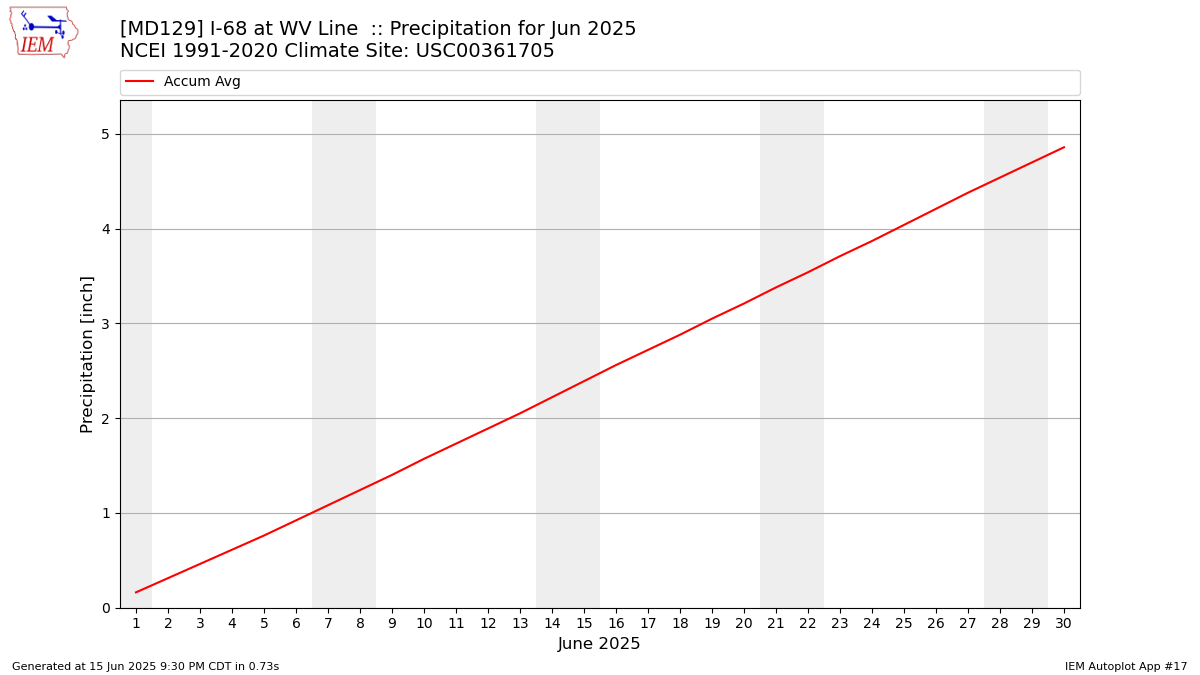
Description: This chart is of daily precipitation for the month. The red line would be an average month while the blue line and bars are observations.
Daily Average Wind Speeds
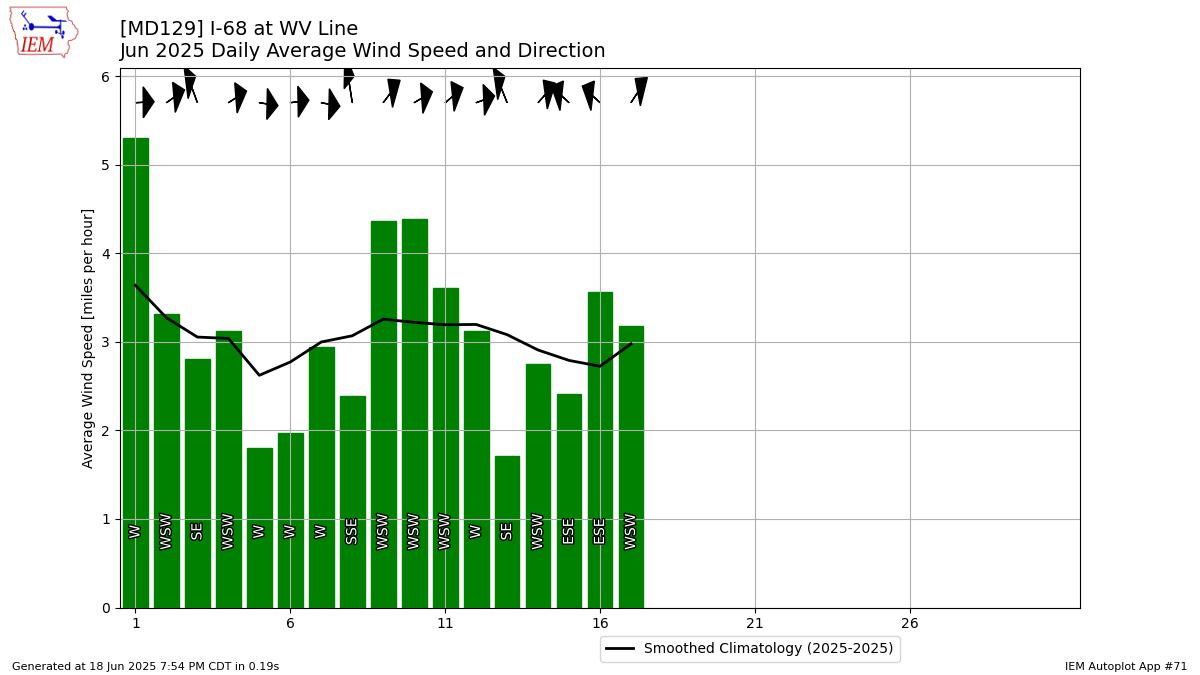
Description: This chart is of the daily average wind speeds.
The data presented here provided by IEM API webservice: daily.json. A simple CSV option exists as well.