| May 2025 | Jun 2025 | Jul 2025 | ||||
|---|---|---|---|---|---|---|
| Sunday | Monday | Tuesday | Wednesday | Thursday | Friday | Saturday |
| 01 High: 67.47979 Low: 43.620777 Precip: M Avg Wind: NW @ 1.6 Gust: 14 (12:53 PM) RH% Min/Max: 46-91 Feel Min/Max: 44 to 67 | 02 High: 72.699776 Low: 43.610012 Precip: M Avg Wind: NNW @ 2.5 Gust: 16 (10:43 AM) RH% Min/Max: 33-94 Feel Min/Max: 44 to 73 | 03 High: 80.279625 Low: 48.520405 Precip: M Avg Wind: NNW @ 1.3 Gust: 11 (1:23 PM) RH% Min/Max: 35-93 Feel Min/Max: 49 to 80 | 04 High: 85.69039 Low: 54.159798 Precip: M Avg Wind: NNW @ 1.3 Gust: 8 (5:53 PM) RH% Min/Max: 51-92 Feel Min/Max: 54 to 88 | 05 High: 84.189224 Low: 65.42963 Precip: M Avg Wind: WNW @ 1.3 Gust: 10 (3:53 PM) RH% Min/Max: 61-92 Feel Min/Max: 65 to 88 | 06 High: 84.12978 Low: 63.049988 Precip: M Avg Wind: N @ 1.6 Gust: 10 (4:33 PM) RH% Min/Max: 57-95 Feel Min/Max: 63 to 87 | 07 High: 83.15057 Low: 67.130585 Precip: M Avg Wind: NNW @ 1.8 Gust: 13 (10:03 AM) RH% Min/Max: 59-97 Feel Min/Max: 67 to 86 |
| 08 High: 72.2606 Low: 66.70042 Precip: M Avg Wind: ESE @ 3.2 Gust: 13 (6:03 PM) RH% Min/Max: 76-96 Feel Min/Max: 67 to 72 | 09 High: 81.449615 Low: 65.78059 Precip: M Avg Wind: ESE @ 1.7 Gust: 10 (12:23 PM) RH% Min/Max: 64-99 Feel Min/Max: 66 to 85 | 10 High: 83.73922 Low: 67.91001 Precip: M Avg Wind: NNW @ 2.7 Gust: 17 (10:23 AM) RH% Min/Max: 44-97 Feel Min/Max: 68 to 84 | 11 High: 83.17941 Low: 62.029415 Precip: M Avg Wind: NW @ 1.9 Gust: 13 (12:23 PM) RH% Min/Max: 45-98 Feel Min/Max: 62 to 84 | 12 High: 88.460594 Low: 62.72062 Precip: M Avg Wind: NW @ 1.8 Gust: 13 (10:33 AM) RH% Min/Max: 44-95 Feel Min/Max: 63 to 90 | 13 High: 87.83959 Low: 66.09919 Precip: M Avg Wind: ESE @ 2.0 Gust: 18 (4:53 PM) RH% Min/Max: 53-97 Feel Min/Max: 66 to 95 | 14 High: 82.59978 Low: 69.72979 Precip: M Avg Wind: E @ 1.9 Gust: 15 (10:13 PM) RH% Min/Max: 70-98 Feel Min/Max: 70 to 87 |
| 15 High: 69.600204 Low: 62.589222 Precip: M Avg Wind: ESE @ 3.3 Gust: 15 (6:23 AM) RH% Min/Max: 91-98 Feel Min/Max: 63 to 70 | 16 High: 66.29002 Low: 61.610012 Precip: M Avg Wind: ENE @ 1.6 Gust: 11 (4:33 AM) RH% Min/Max: 95-99 Feel Min/Max: 62 to 66 | 17 High: 66.189224 Low: 65.76982 Precip: M Gust: 6 (1:33 AM) RH% Min/Max: 99-99 Feel Min/Max: 66 to 66 | 18 Precip: M | 19 | 20 | 21 |
| 22 | 23 | 24 | 25 | 26 | 27 | 28 |
| 29 | 30 | 01 | 02 | 03 | 04 | 05 |
The data presented here provided by IEM API webservice: daily.json. A simple CSV option exists as well.
Daily High/Low Plot
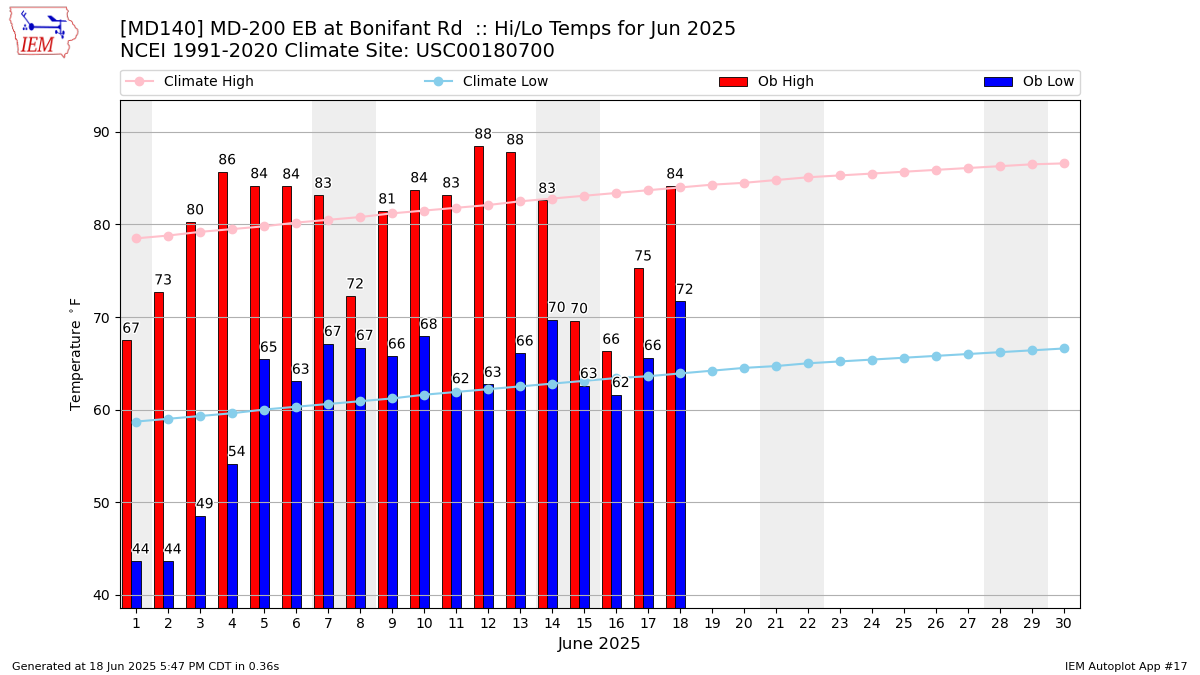
Description: This chart of the monthly temperature data. The bars are the observations and the dots are climatology.
Daily Rainfall
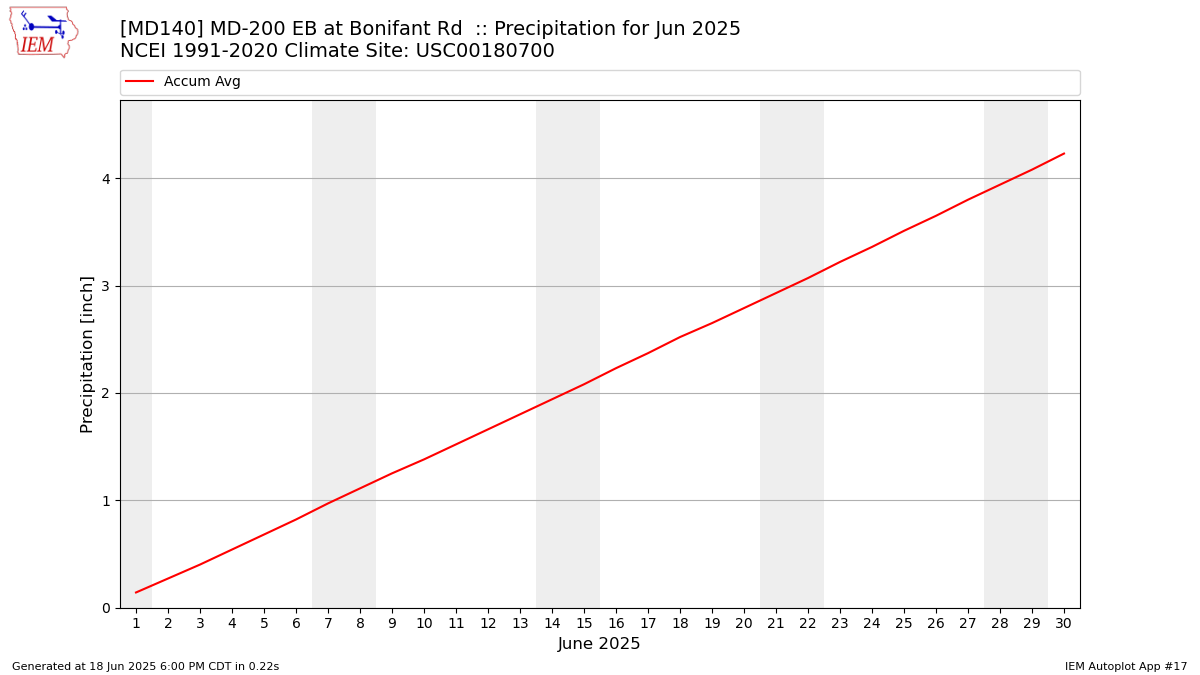
Description: This chart is of daily precipitation for the month. The red line would be an average month while the blue line and bars are observations.
Daily Average Wind Speeds
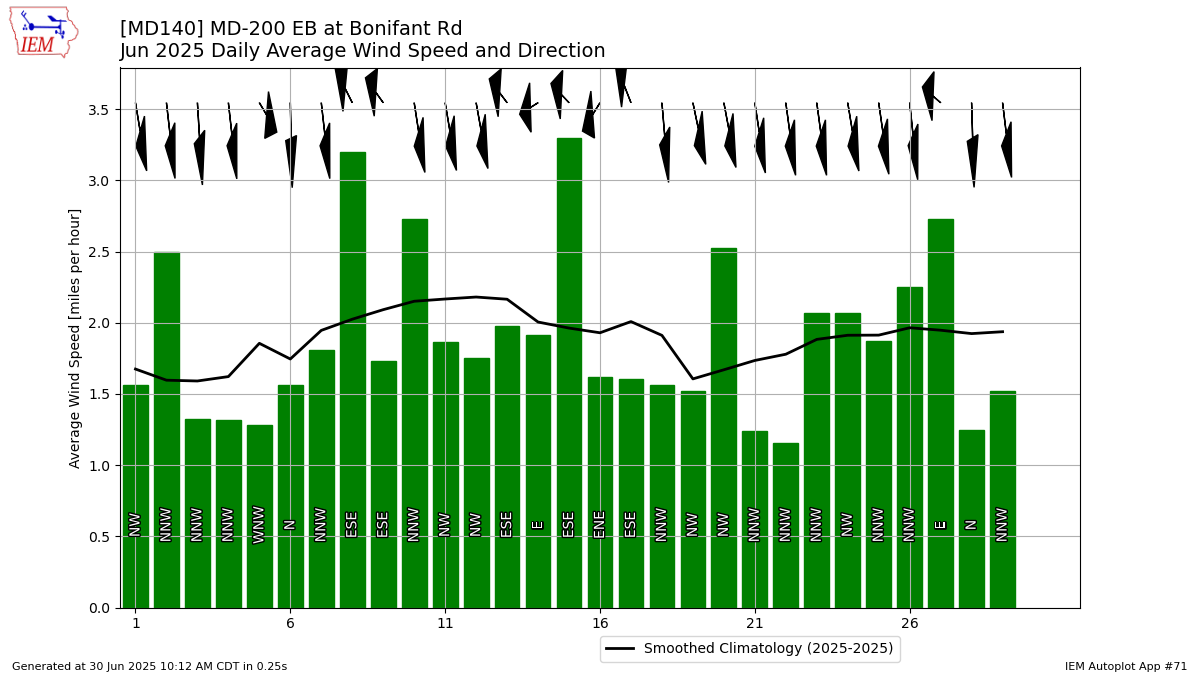
Description: This chart is of the daily average wind speeds.
The data presented here provided by IEM API webservice: daily.json. A simple CSV option exists as well.