| May 2025 | Jun 2025 | Jul 2025 | ||||
|---|---|---|---|---|---|---|
| Sunday | Monday | Tuesday | Wednesday | Thursday | Friday | Saturday |
| 01 High: 63.809586 Low: 44.76918 Precip: M Avg Wind: WNW @ 3.5 Gust: 21 (11:50 AM) RH% Min/Max: 39-80 Feel Min/Max: 45 to 64 | 02 High: 72.37942 Low: 44.07979 Precip: M Avg Wind: WNW @ 2.2 Gust: 16 (3:10 PM) RH% Min/Max: 28-84 Feel Min/Max: 44 to 72 | 03 High: 76.98922 Low: 49.49962 Precip: M Avg Wind: SSE @ 1.9 Gust: 12 (4:40 PM) RH% Min/Max: 37-82 Feel Min/Max: 49 to 77 | 04 High: 84.9308 Low: 58.170193 Precip: M Avg Wind: SE @ 1.6 Gust: 14 (3:20 PM) RH% Min/Max: 48-84 Feel Min/Max: 58 to 87 | 05 High: 83.17941 Low: 64.38021 Precip: M Avg Wind: WNW @ 1.9 Gust: 16 (11:10 PM) RH% Min/Max: 54-88 Feel Min/Max: 64 to 86 | 06 High: 77.210594 Low: 65.84002 Precip: M Avg Wind: SSE @ 1.1 Gust: 19 (11:50 AM) RH% Min/Max: 70-100 Feel Min/Max: 66 to 77 | 07 High: 78.99978 Low: 64.79061 Precip: M Avg Wind: WNW @ 2.0 Gust: 15 (4:40 PM) RH% Min/Max: 54-100 Feel Min/Max: 65 to 79 |
| 08 High: 68.01081 Low: 61.109585 Precip: M Avg Wind: NE @ 1.5 Gust: 10 (6:50 PM) RH% Min/Max: 72-100 Feel Min/Max: 61 to 68 | 09 High: 78.83959 Low: 63.280373 Precip: M Avg Wind: SSE @ 1.4 Gust: 12 (4:40 PM) RH% Min/Max: 68-100 Feel Min/Max: 63 to 79 | 10 High: 76.74978 Low: 61.88 Precip: M Avg Wind: W @ 1.9 Gust: 17 (5:10 PM) RH% Min/Max: 51-100 Feel Min/Max: 62 to 77 | 11 High: 81.89962 Low: 56.42062 Precip: M Avg Wind: WSW @ 1.6 Gust: 11 (3:40 PM) RH% Min/Max: 42-96 Feel Min/Max: 56 to 82 | 12 High: 86.03059 Low: 63.91939 Precip: M Avg Wind: SW @ 1.6 Gust: 13 (12:50 AM) RH% Min/Max: 46-86 Feel Min/Max: 64 to 87 | 13 High: 79.030426 Low: 65.64919 Precip: M Avg Wind: E @ 1.4 Gust: 10 (12:20 PM) RH% Min/Max: 66-99 Feel Min/Max: 66 to 79 | 14 High: 79.9106 Low: 65.46918 Precip: M Avg Wind: ESE @ 1.3 Gust: 16 (5:30 PM) RH% Min/Max: 75-100 Feel Min/Max: 65 to 80 |
| 15 High: 67.78938 Low: 60.8792 Precip: M Avg Wind: E @ 3.0 Gust: 11 (7:50 PM) RH% Min/Max: 100-100 Feel Min/Max: 61 to 68 | 16 High: 60.99082 Low: 59.570618 Precip: M Gust: 7 (3:50 AM) RH% Min/Max: 100-100 Feel Min/Max: 60 to 61 | 17 Precip: M | 18 | 19 | 20 | 21 |
| 22 | 23 | 24 | 25 | 26 | 27 | 28 |
| 29 | 30 | 01 | 02 | 03 | 04 | 05 |
The data presented here provided by IEM API webservice: daily.json. A simple CSV option exists as well.
Daily High/Low Plot

Description: This chart of the monthly temperature data. The bars are the observations and the dots are climatology.
Daily Rainfall
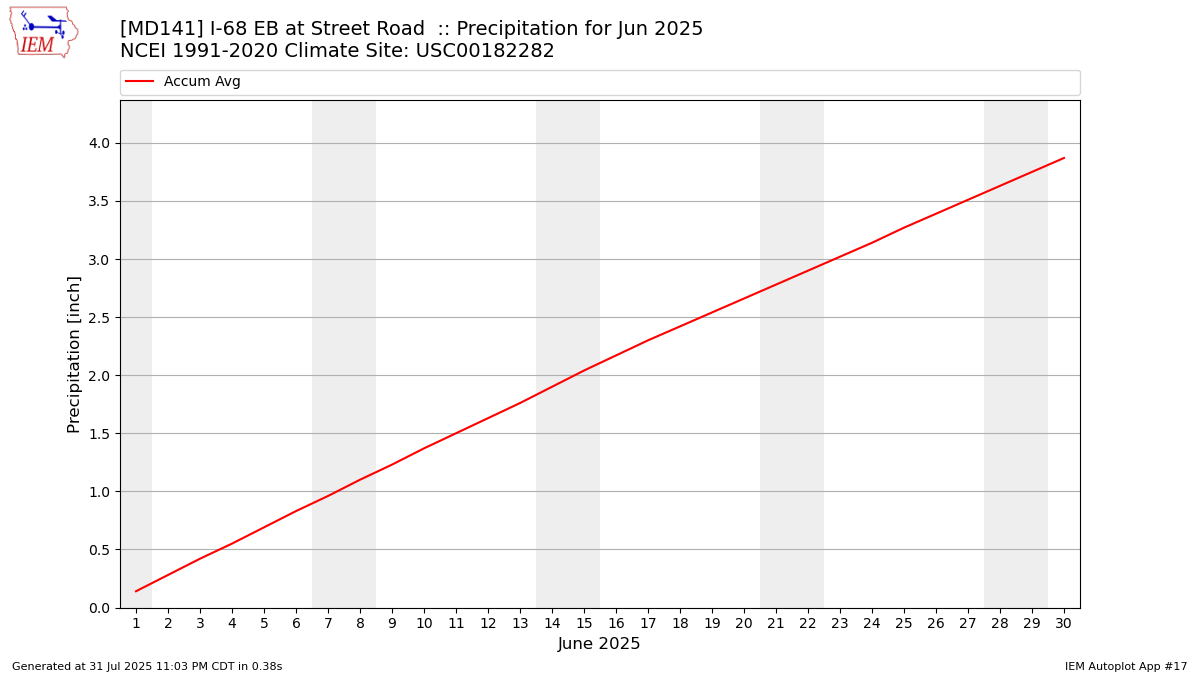
Description: This chart is of daily precipitation for the month. The red line would be an average month while the blue line and bars are observations.
Daily Average Wind Speeds
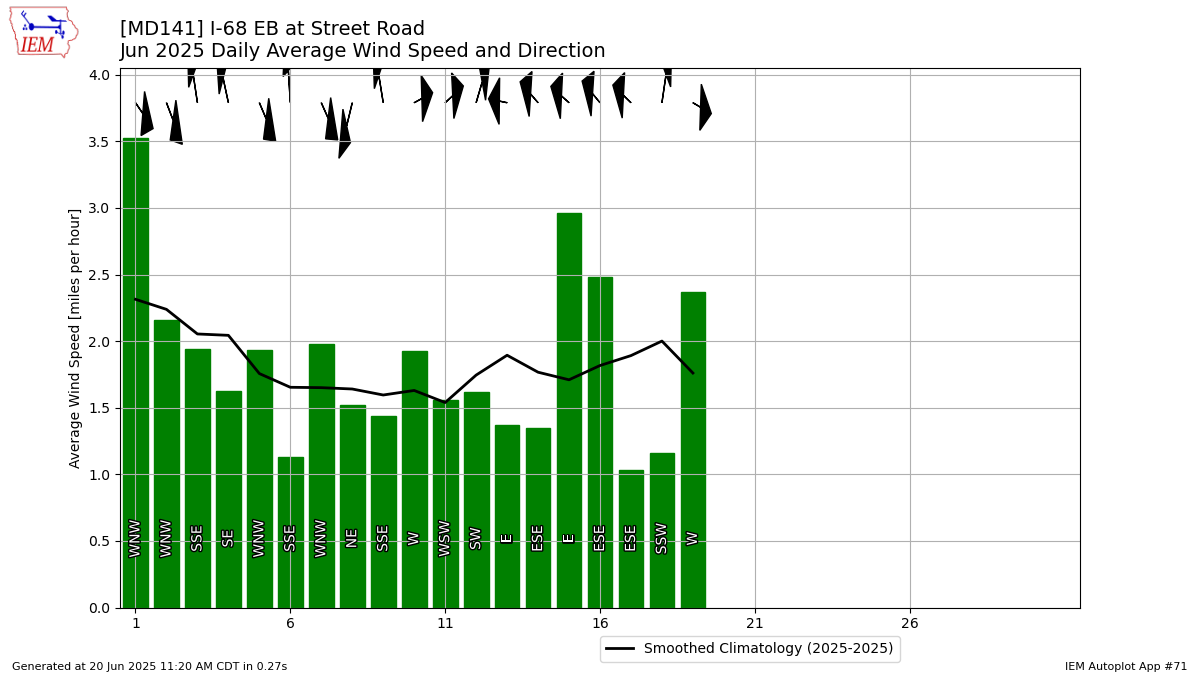
Description: This chart is of the daily average wind speeds.
The data presented here provided by IEM API webservice: daily.json. A simple CSV option exists as well.