| May 2025 | Jun 2025 | Jul 2025 | ||||
|---|---|---|---|---|---|---|
| Sunday | Monday | Tuesday | Wednesday | Thursday | Friday | Saturday |
| 01 High: 64.724 Low: 36.194 Precip: M RH% Min/Max: 47-88 Feel Min/Max: 34 to 65 | 02 High: 74.624 Low: 43.502 Precip: M RH% Min/Max: 32-88 Feel Min/Max: 42 to 75 | 03 High: 84.038 Low: 61.7 Precip: M RH% Min/Max: 53-72 Feel Min/Max: 62 to 86 | 04 High: 77.702 Low: 57.902 Precip: 5.10 RH% Min/Max: 62-94 Feel Min/Max: 58 to 78 | 05 High: 75.902 Low: 55.94 Precip: M RH% Min/Max: 45-89 Feel Min/Max: 56 to 76 | 06 High: 77.612 Low: 56.534 Precip: M RH% Min/Max: 34-69 Feel Min/Max: 57 to 78 | 07 High: 77.576 Low: 56.3 Precip: M RH% Min/Max: 40-62 Feel Min/Max: 56 to 78 |
| 08 High: 77.162 Low: 57.83 Precip: 1.30 RH% Min/Max: 51-93 Feel Min/Max: 58 to 77 | 09 High: 70.232 Low: 53.258 Precip: 3.60 RH% Min/Max: 60-96 Feel Min/Max: 53 to 70 | 10 High: 62.96 Low: 50.468 Precip: M RH% Min/Max: 74-90 Feel Min/Max: 50 to 63 | 11 High: 79.448 Low: 53.618 Precip: M RH% Min/Max: 55-89 Feel Min/Max: 54 to 79 | 12 High: 74.12 Low: 62.672 Precip: M RH% Min/Max: 62-84 Feel Min/Max: 63 to 74 | 13 High: 72.68 Low: 58.118 Precip: M RH% Min/Max: 53-84 Feel Min/Max: 58 to 73 | 14 High: 78.314 Low: 53.42 Precip: M RH% Min/Max: 52-83 Feel Min/Max: 53 to 78 |
| 15 High: 79.124 Low: 56.57 Precip: M RH% Min/Max: 58-81 Feel Min/Max: 57 to 79 | 16 High: 83.606 Low: 61.376 Precip: M RH% Min/Max: 52-78 Feel Min/Max: 61 to 85 | 17 High: 84.974 Low: 65.894 Precip: M RH% Min/Max: 64-87 Feel Min/Max: 66 to 91 | 18 High: 79.646 Low: 67.604 Precip: 8.50 RH% Min/Max: 74-94 Feel Min/Max: 68 to 80 | 19 High: 74.156 Low: 61.556 Precip: 5.90 RH% Min/Max: 72-95 Feel Min/Max: 62 to 74 | 20 High: 79.016 Low: 60.458 Precip: 0.30 RH% Min/Max: 66-92 Feel Min/Max: 60 to 79 | 21 High: 90.716 Low: 74.192 Precip: M RH% Min/Max: 56-83 Feel Min/Max: 74 to 99 |
| 22 High: 89.69 Low: 77.594 Precip: M RH% Min/Max: 63-85 Feel Min/Max: 78 to 101 | 23 High: 90.05 Low: 76.784 Precip: M RH% Min/Max: 57-85 Feel Min/Max: 77 to 99 | 24 High: 87.926 Low: 66.434 Precip: M RH% Min/Max: 63-92 Feel Min/Max: 66 to 98 | 25 High: 78.998 Low: 70.34 Precip: 9.90 RH% Min/Max: 79-95 Feel Min/Max: 70 to 79 | 26 High: 87.584 Low: 65.732 Precip: 0.80 RH% Min/Max: 72-94 Feel Min/Max: 66 to 101 | 27 High: 83.336 Low: 69.836 Precip: 22.40 RH% Min/Max: 70-94 Feel Min/Max: 70 to 89 | 28 High: 76.892 Low: 61.898 Precip: M RH% Min/Max: 65-88 Feel Min/Max: 62 to 77 |
| 29 Precip: M | 30 | 01 | 02 | 03 | 04 | 05 |
The data presented here provided by IEM API webservice: daily.json. A simple CSV option exists as well.
Daily High/Low Plot

Description: This chart of the monthly temperature data. The bars are the observations and the dots are climatology.
Daily Rainfall
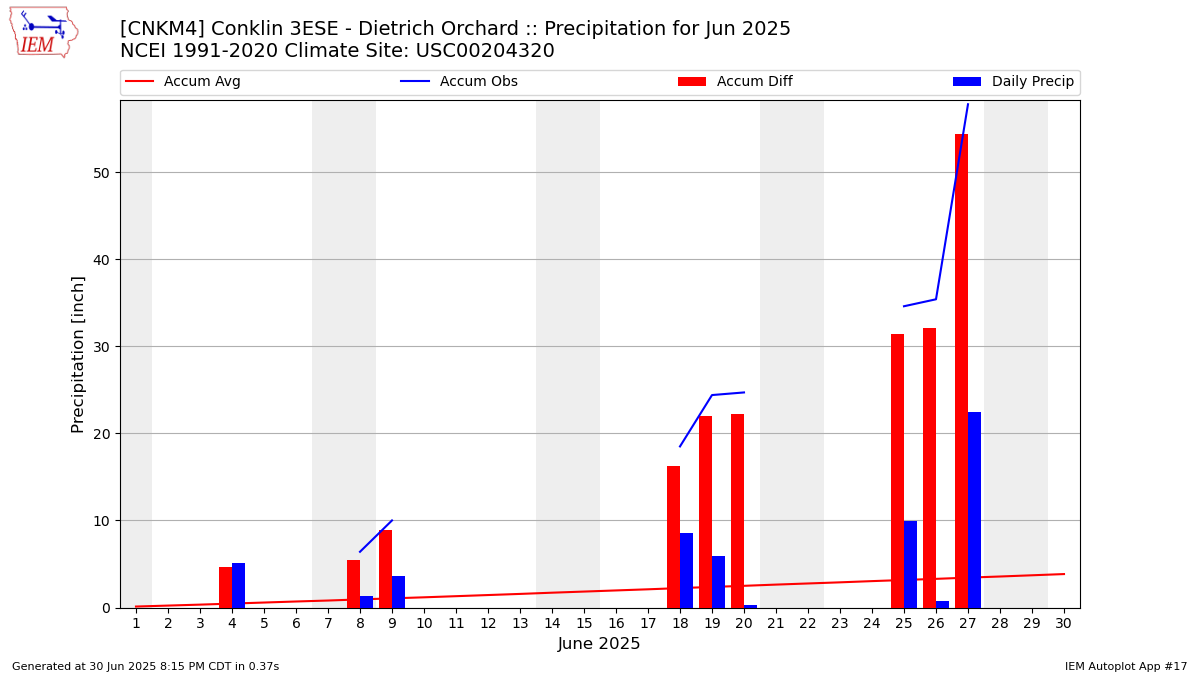
Description: This chart is of daily precipitation for the month. The red line would be an average month while the blue line and bars are observations.
Daily Average Wind Speeds
Description: This chart is of the daily average wind speeds.
The data presented here provided by IEM API webservice: daily.json. A simple CSV option exists as well.