| May 2025 | Jun 2025 | Jul 2025 | ||||
|---|---|---|---|---|---|---|
| Sunday | Monday | Tuesday | Wednesday | Thursday | Friday | Saturday |
| 01 High: 68.864 Low: 36.644 Precip: M RH% Min/Max: 28-90 Feel Min/Max: 34 to 69 | 02 High: 76.154 Low: 39.92 Precip: M RH% Min/Max: 23-100 Feel Min/Max: 40 to 76 | 03 High: 84.902 Low: 55.76 Precip: M RH% Min/Max: 42-69 Feel Min/Max: 56 to 85 | 04 High: 77.018 Low: 59.756 Precip: 4.50 RH% Min/Max: 57-100 Feel Min/Max: 60 to 77 | 05 High: 75.794 Low: 54.068 Precip: M RH% Min/Max: 30-100 Feel Min/Max: 54 to 76 | 06 High: 77.45 Low: 51.962 Precip: M RH% Min/Max: 28-92 Feel Min/Max: 52 to 77 | 07 High: 77.396 Low: 48.794 Precip: M RH% Min/Max: 31-98 Feel Min/Max: 49 to 77 |
| 08 High: 79.088 Low: 55.4 Precip: 1.60 RH% Min/Max: 34-100 Feel Min/Max: 55 to 79 | 09 High: 75.11 Low: 53.762 Precip: 1.30 RH% Min/Max: 37-100 Feel Min/Max: 54 to 75 | 10 High: 64.76 Low: 51.746 Precip: M RH% Min/Max: 64-100 Feel Min/Max: 52 to 65 | 11 High: 81.356 Low: 48.578 Precip: M RH% Min/Max: 43-100 Feel Min/Max: 49 to 81 | 12 High: 74.138 Low: 59.468 Precip: 0.30 RH% Min/Max: 50-99 Feel Min/Max: 59 to 74 | 13 High: 72.392 Low: 55.94 Precip: M RH% Min/Max: 44-74 Feel Min/Max: 56 to 72 | 14 High: 76.334 Low: 52.736 Precip: M RH% Min/Max: 46-85 Feel Min/Max: 53 to 76 |
| 15 High: 76.928 Low: 55.364 Precip: M RH% Min/Max: 45-89 Feel Min/Max: 55 to 77 | 16 High: 83.408 Low: 54.752 Precip: M RH% Min/Max: 42-99 Feel Min/Max: 55 to 83 | 17 High: 85.838 Low: 66.038 Precip: M RH% Min/Max: 52-100 Feel Min/Max: 66 to 88 | 18 High: 76.172 Low: 66.344 Precip: 11.70 RH% Min/Max: 73-100 Feel Min/Max: 66 to 76 | 19 High: 75.074 Low: 59.792 Precip: 12.40 RH% Min/Max: 66-100 Feel Min/Max: 60 to 75 | 20 High: 78.062 Low: 57.866 Precip: M RH% Min/Max: 66-100 Feel Min/Max: 58 to 78 | 21 High: 90.734 Low: 70.934 Precip: 2.50 RH% Min/Max: 52-100 Feel Min/Max: 71 to 98 |
| 22 High: 91.598 Low: 79.304 Precip: M RH% Min/Max: 49-83 Feel Min/Max: 79 to 99 | 23 High: 92.066 Low: 76.55 Precip: M RH% Min/Max: 44-94 Feel Min/Max: 77 to 97 | 24 High: 87.098 Low: 69.224 Precip: M RH% Min/Max: 58-100 Feel Min/Max: 69 to 93 | 25 High: 73.166 Low: 72.59 Precip: M RH% Min/Max: 100-100 Feel Min/Max: 73 to 73 | 26 Precip: M | 27 | 28 |
| 29 | 30 | 01 | 02 | 03 | 04 | 05 |
The data presented here provided by IEM API webservice: daily.json. A simple CSV option exists as well.
Daily High/Low Plot
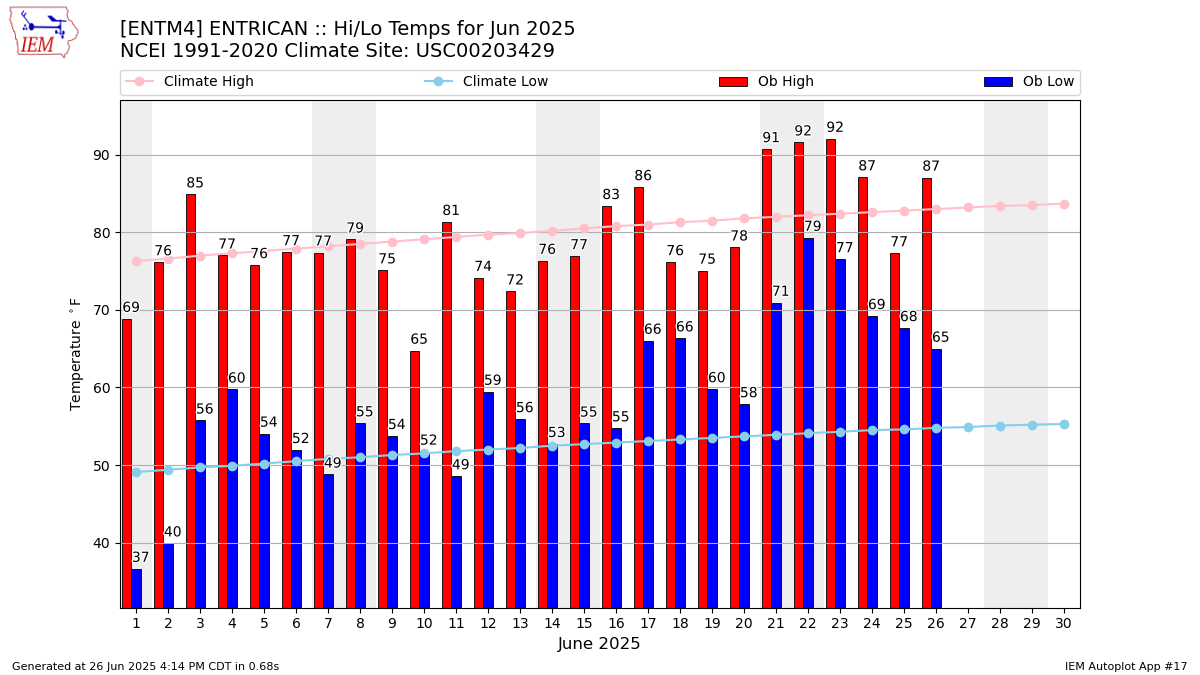
Description: This chart of the monthly temperature data. The bars are the observations and the dots are climatology.
Daily Rainfall

Description: This chart is of daily precipitation for the month. The red line would be an average month while the blue line and bars are observations.
Daily Average Wind Speeds

Description: This chart is of the daily average wind speeds.
The data presented here provided by IEM API webservice: daily.json. A simple CSV option exists as well.