| May 2025 | Jun 2025 | Jul 2025 | ||||
|---|---|---|---|---|---|---|
| Sunday | Monday | Tuesday | Wednesday | Thursday | Friday | Saturday |
| 01 High: 65.3 Low: 38.498 Precip: M RH% Min/Max: 32-90 Feel Min/Max: 38 to 65 | 02 High: 78.818 Low: 39.524 Precip: M RH% Min/Max: 23-76 Feel Min/Max: 40 to 79 | 03 High: 83.894 Low: 60.71 Precip: M RH% Min/Max: 37-59 Feel Min/Max: 61 to 83 | 04 High: 75.146 Low: 59.072 Precip: 9.20 RH% Min/Max: 52-92 Feel Min/Max: 59 to 75 | 05 High: 71.15 Low: 57.416 Precip: M RH% Min/Max: 58-96 Feel Min/Max: 57 to 71 | 06 High: 74.138 Low: 55.796 Precip: M RH% Min/Max: 46-88 Feel Min/Max: 56 to 74 | 07 High: 75.344 Low: 53.636 Precip: M RH% Min/Max: 39-81 Feel Min/Max: 54 to 75 |
| 08 High: 77.108 Low: 56.858 Precip: 3.20 RH% Min/Max: 50-89 Feel Min/Max: 57 to 77 | 09 High: 73.76 Low: 52.79 Precip: M RH% Min/Max: 38-89 Feel Min/Max: 53 to 74 | 10 High: 72.248 Low: 49.244 Precip: M RH% Min/Max: 48-88 Feel Min/Max: 49 to 72 | 11 High: 84.164 Low: 57.02 Precip: M RH% Min/Max: 35-77 Feel Min/Max: 57 to 83 | 12 High: 84.272 Low: 63.194 Precip: M RH% Min/Max: 47-78 Feel Min/Max: 63 to 85 | 13 High: 67.298 Low: 61.376 Precip: 1.40 RH% Min/Max: 57-92 Feel Min/Max: 61 to 67 | 14 High: 75.902 Low: 58.604 Precip: M RH% Min/Max: 60-93 Feel Min/Max: 59 to 76 |
| 15 High: 82.274 Low: 56.876 Precip: M RH% Min/Max: 48-91 Feel Min/Max: 57 to 83 | 16 High: 82.922 Low: 60.746 Precip: M RH% Min/Max: 42-84 Feel Min/Max: 61 to 83 | 17 High: 88.034 Low: 66.452 Precip: M RH% Min/Max: 44-86 Feel Min/Max: 66 to 90 | 18 High: 84.686 Low: 65.498 Precip: 23.20 RH% Min/Max: 56-94 Feel Min/Max: 65 to 88 | 19 High: 79.214 Low: 59.846 Precip: 3.10 RH% Min/Max: 49-97 Feel Min/Max: 60 to 79 | 20 High: 80.186 Low: 61.808 Precip: M RH% Min/Max: 52-90 Feel Min/Max: 62 to 81 | 21 High: 89.618 Low: 70.484 Precip: M RH% Min/Max: 50-76 Feel Min/Max: 70 to 94 |
| 22 High: 90.986 Low: 75.614 Precip: M RH% Min/Max: 50-80 Feel Min/Max: 76 to 97 | 23 High: 91.868 Low: 72.284 Precip: M RH% Min/Max: 42-85 Feel Min/Max: 72 to 95 | 24 High: 92.822 Low: 71.582 Precip: M RH% Min/Max: 49-88 Feel Min/Max: 72 to 100 | 25 High: 86.558 Low: 67.91 Precip: 8.80 RH% Min/Max: 56-94 Feel Min/Max: 68 to 93 | 26 High: 89.348 Low: 69.71 Precip: 28.50 RH% Min/Max: 60-90 Feel Min/Max: 70 to 99 | 27 High: 87.566 Low: 68.72 Precip: 4.80 RH% Min/Max: 55-91 Feel Min/Max: 69 to 94 | 28 High: 82.058 Low: 62.384 Precip: M RH% Min/Max: 51-90 Feel Min/Max: 62 to 83 |
| 29 Precip: M | 30 | 01 | 02 | 03 | 04 | 05 |
The data presented here provided by IEM API webservice: daily.json. A simple CSV option exists as well.
Daily High/Low Plot
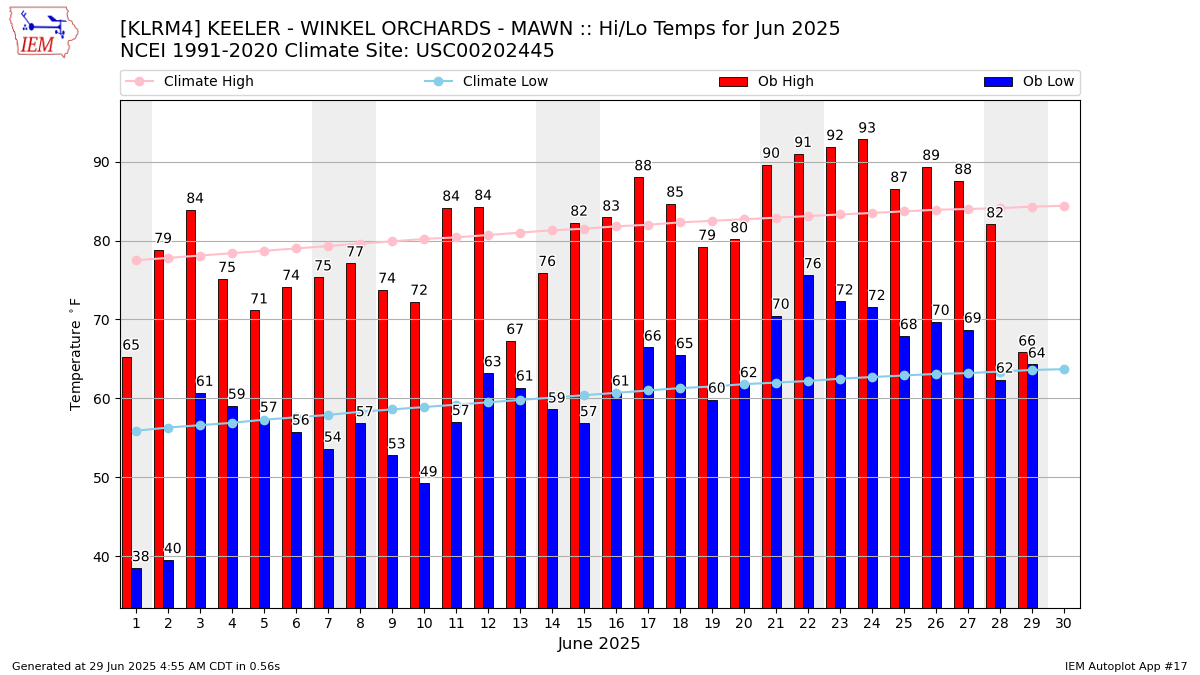
Description: This chart of the monthly temperature data. The bars are the observations and the dots are climatology.
Daily Rainfall
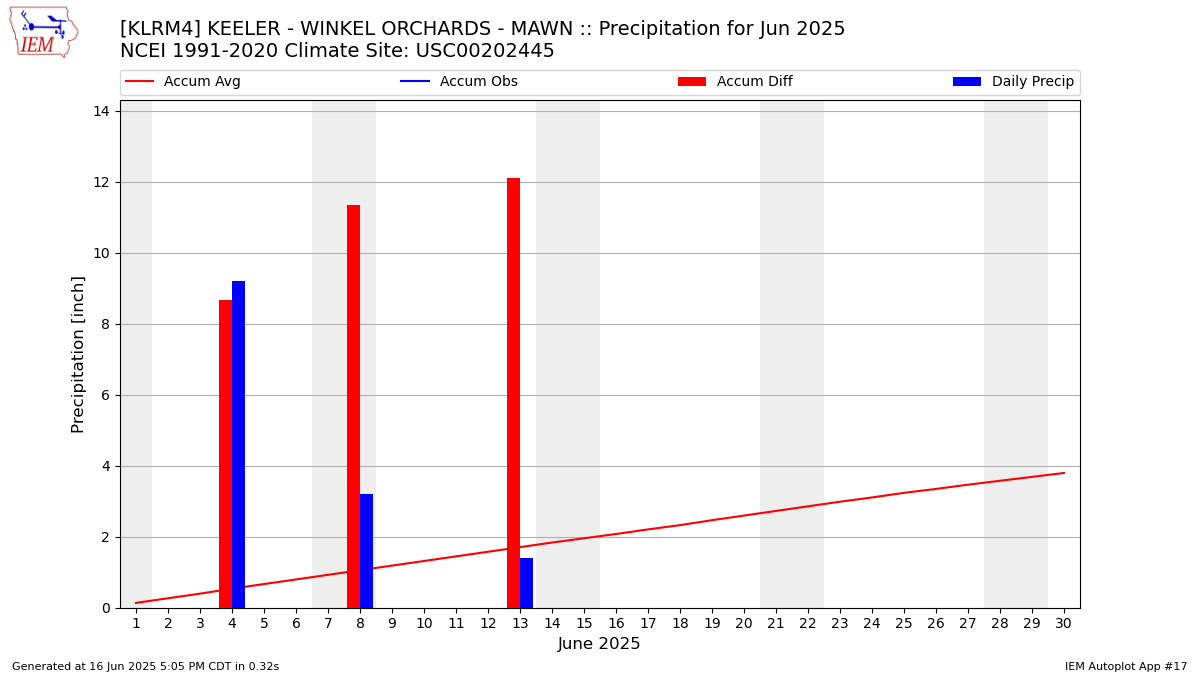
Description: This chart is of daily precipitation for the month. The red line would be an average month while the blue line and bars are observations.
Daily Average Wind Speeds
Description: This chart is of the daily average wind speeds.
The data presented here provided by IEM API webservice: daily.json. A simple CSV option exists as well.