| May 2025 | Jun 2025 | Jul 2025 | ||||
|---|---|---|---|---|---|---|
| Sunday | Monday | Tuesday | Wednesday | Thursday | Friday | Saturday |
| 01 High: 66.596 Low: 37.94 Precip: M RH% Min/Max: 43-87 Feel Min/Max: 36 to 67 | 02 High: 74.444 Low: 41.864 Precip: M RH% Min/Max: 35-85 Feel Min/Max: 42 to 74 | 03 High: 84.686 Low: 60.548 Precip: M RH% Min/Max: 53-71 Feel Min/Max: 61 to 87 | 04 High: 77.414 Low: 57.344 Precip: 6.50 RH% Min/Max: 63-93 Feel Min/Max: 57 to 77 | 05 High: 75.2 Low: 54.446 Precip: M RH% Min/Max: 49-94 Feel Min/Max: 54 to 75 | 06 High: 76.082 Low: 54.392 Precip: M RH% Min/Max: 42-72 Feel Min/Max: 54 to 76 | 07 High: 76.892 Low: 53.366 Precip: M RH% Min/Max: 45-72 Feel Min/Max: 53 to 77 |
| 08 High: 78.044 Low: 57.182 Precip: M RH% Min/Max: 51-92 Feel Min/Max: 57 to 78 | 09 High: 71.564 Low: 53.51 Precip: 0.60 RH% Min/Max: 56-95 Feel Min/Max: 54 to 72 | 10 High: 62.834 Low: 49.64 Precip: M RH% Min/Max: 69-90 Feel Min/Max: 49 to 63 | 11 High: 79.106 Low: 51.836 Precip: M RH% Min/Max: 57-90 Feel Min/Max: 52 to 79 | 12 High: 73.418 Low: 60.602 Precip: 0.80 RH% Min/Max: 58-84 Feel Min/Max: 61 to 73 | 13 High: 72.932 Low: 54.878 Precip: 1.30 RH% Min/Max: 54-77 Feel Min/Max: 55 to 73 | 14 High: 77.558 Low: 53.474 Precip: M RH% Min/Max: 52-78 Feel Min/Max: 53 to 78 |
| 15 High: 78.224 Low: 55.976 Precip: M RH% Min/Max: 60-78 Feel Min/Max: 56 to 78 | 16 High: 82.742 Low: 59.504 Precip: M RH% Min/Max: 54-78 Feel Min/Max: 60 to 85 | 17 High: 84.47 Low: 64.958 Precip: M RH% Min/Max: 61-87 Feel Min/Max: 65 to 89 | 18 High: 76.802 Low: 67.1 Precip: 12.70 RH% Min/Max: 77-94 Feel Min/Max: 67 to 77 | 19 High: 74.138 Low: 60.854 Precip: 9.10 RH% Min/Max: 68-94 Feel Min/Max: 61 to 74 | 20 High: 78.26 Low: 59.954 Precip: 0.30 RH% Min/Max: 66-92 Feel Min/Max: 60 to 78 | 21 High: 89.132 Low: 72.554 Precip: 1.10 RH% Min/Max: 58-80 Feel Min/Max: 73 to 97 |
| 22 Precip: M | 23 | 24 | 25 | 26 | 27 | 28 |
| 29 | 30 | 01 | 02 | 03 | 04 | 05 |
The data presented here provided by IEM API webservice: daily.json. A simple CSV option exists as well.
Daily High/Low Plot
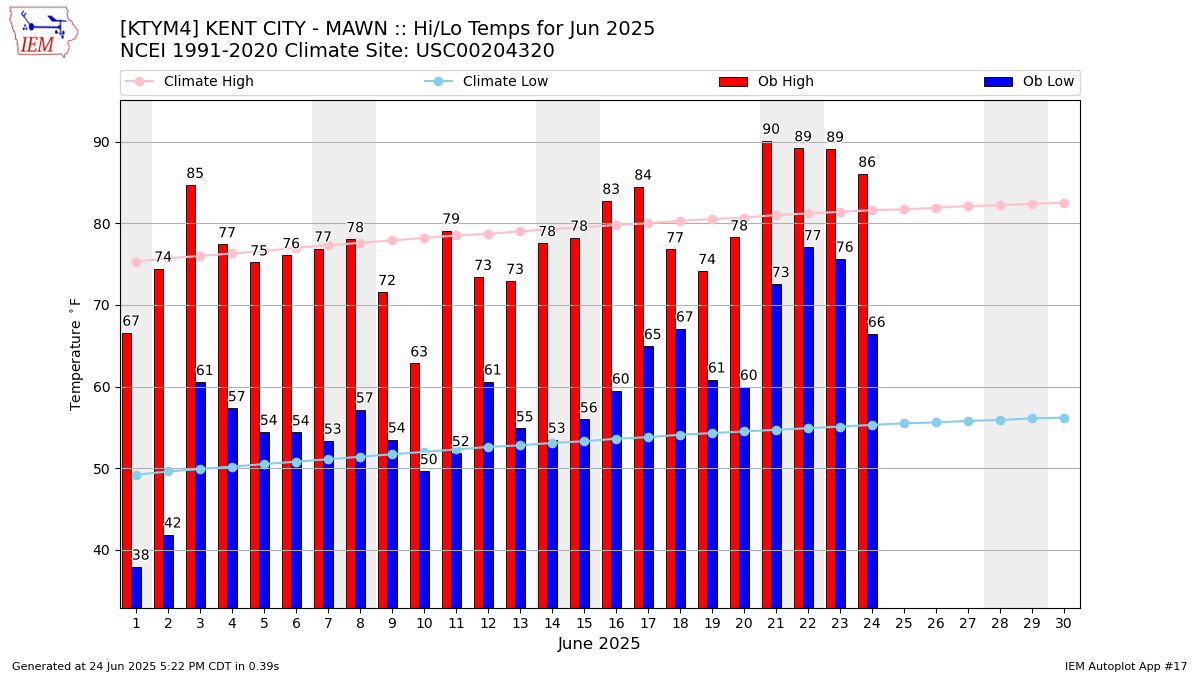
Description: This chart of the monthly temperature data. The bars are the observations and the dots are climatology.
Daily Rainfall
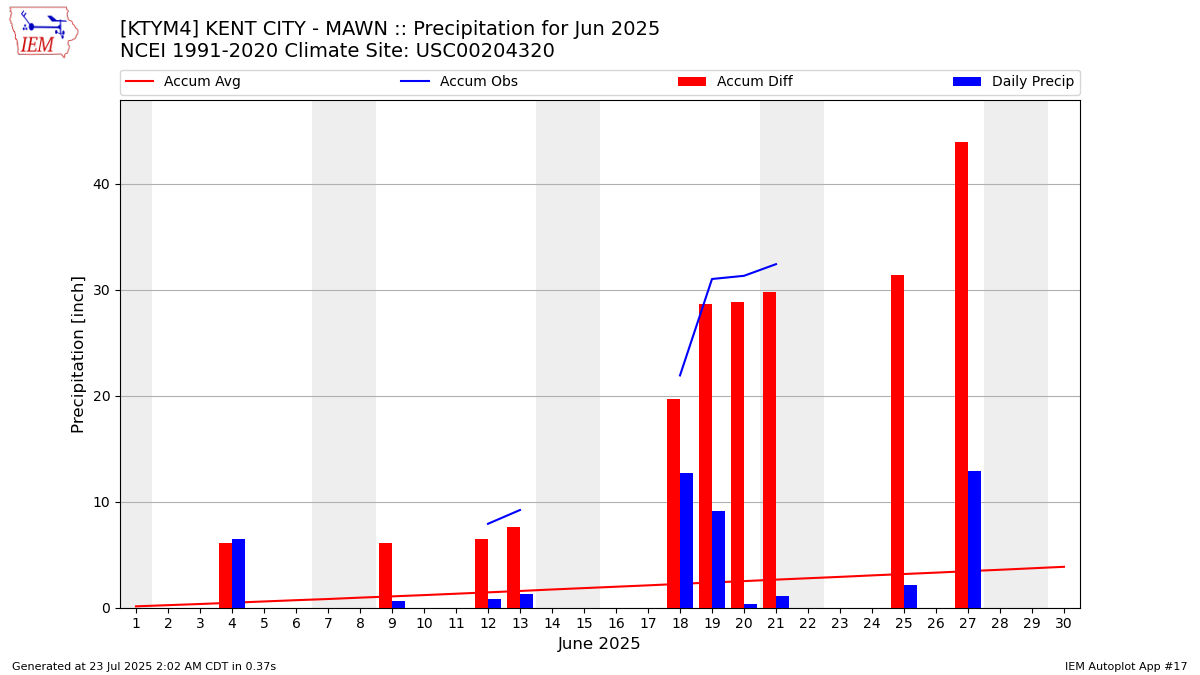
Description: This chart is of daily precipitation for the month. The red line would be an average month while the blue line and bars are observations.
Daily Average Wind Speeds
Description: This chart is of the daily average wind speeds.
The data presented here provided by IEM API webservice: daily.json. A simple CSV option exists as well.