| May 2025 | Jun 2025 | Jul 2025 | ||||
|---|---|---|---|---|---|---|
| Sunday | Monday | Tuesday | Wednesday | Thursday | Friday | Saturday |
| 01 High: 81.76998 Low: 40.609425 Precip: M Avg Wind: N @ 0.0 RH% Min/Max: 29-99 Feel Min/Max: 51 to 81 | 02 High: 90.3002 Low: 46.95079 Precip: M Avg Wind: N @ 0.0 RH% Min/Max: 29-98 Feel Min/Max: 50 to 89 | 03 High: 71.20937 Low: 50.5598 Precip: M Avg Wind: N @ 0.0 RH% Min/Max: 74-98 Feel Min/Max: 51 to 71 | 04 High: 80.419975 Low: 41.050415 Precip: M Avg Wind: N @ 0.0 RH% Min/Max: 24-99 Feel Min/Max: 50 to 80 | 05 High: 82.76001 Low: 40.49061 Precip: M Avg Wind: N @ 0.0 RH% Min/Max: 22-99 Feel Min/Max: 60 to 81 | 06 High: 78.31039 Low: 54.68 Precip: M Avg Wind: N @ 0.0 RH% Min/Max: 42-99 Feel Min/Max: 55 to 78 | 07 High: 73.41982 Low: 51.45079 Precip: M Avg Wind: N @ 0.0 RH% Min/Max: 57-99 Feel Min/Max: 51 to 73 |
| 08 High: 76.049614 Low: 52.289597 Precip: M Avg Wind: N @ 0.0 RH% Min/Max: 26-99 Feel Min/Max: 52 to 76 | 09 High: 69.83059 Low: 49.11081 Precip: M Avg Wind: N @ 0.0 RH% Min/Max: 49-90 Feel Min/Max: 50 to 70 | 10 High: 82.97062 Low: 52.239223 Precip: M Avg Wind: N @ 0.0 RH% Min/Max: 32-86 Feel Min/Max: 52 to 82 | 11 High: 83.33059 Low: 55.599777 Precip: M Avg Wind: N @ 0.0 RH% Min/Max: 31-95 Feel Min/Max: 56 to 82 | 12 High: 73.0292 Low: 53.79082 Precip: M Avg Wind: N @ 0.0 RH% Min/Max: 60-98 Feel Min/Max: 54 to 73 | 13 High: 65.24962 Low: 52.9808 Precip: M Avg Wind: N @ 0.0 RH% Min/Max: 68-97 Feel Min/Max: 53 to 65 | 14 High: 70.26081 Low: 51.549774 Precip: M Avg Wind: N @ 0.0 RH% Min/Max: 72-96 Feel Min/Max: 52 to 70 |
| 15 High: 80.56939 Low: 57.790394 Precip: M Avg Wind: N @ 0.0 RH% Min/Max: 61-96 Feel Min/Max: 58 to 83 | 16 High: 80.850204 Low: 64.74018 Precip: M Avg Wind: N @ 0.0 RH% Min/Max: 66-99 Feel Min/Max: 65 to 84 | 17 High: 86.199776 Low: 60.890022 Precip: M Avg Wind: N @ 0.0 RH% Min/Max: 39-99 Feel Min/Max: 61 to 87 | 18 High: 85.240395 Low: 54.759212 Precip: M Avg Wind: N @ 0.0 RH% Min/Max: 42-99 Feel Min/Max: 55 to 86 | 19 High: 89.749405 Low: 50.71998 Precip: M Avg Wind: N @ 0.0 RH% Min/Max: 35-99 Feel Min/Max: 51 to 90 | 20 High: 86.91982 Low: 63.539597 Precip: M Avg Wind: N @ 0.0 RH% Min/Max: 56-88 Feel Min/Max: 64 to 94 | 21 High: 94.2098 Low: 76.65079 Precip: M Avg Wind: N @ 0.0 RH% Min/Max: 54-88 Feel Min/Max: 77 to 110 |
| 22 High: 92.74999 Low: 78.769394 Precip: M Avg Wind: N @ 0.0 RH% Min/Max: 57-78 Feel Min/Max: 79 to 105 | 23 High: 87.31939 Low: 66.11001 Precip: M Avg Wind: N @ 0.0 RH% Min/Max: 56-92 Feel Min/Max: 66 to 93 | 24 High: 82.0994 Low: 60.839596 Precip: M Avg Wind: N @ 0.0 RH% Min/Max: 46-96 Feel Min/Max: 61 to 83 | 25 High: 78.920616 Low: 60.060226 Precip: M Avg Wind: N @ 0.0 RH% Min/Max: 84-98 Feel Min/Max: 60 to 79 | 26 High: 68.34919 Low: 63.719604 Precip: M RH% Min/Max: 86-98 Feel Min/Max: 64 to 68 | 27 Precip: M | 28 |
| 29 | 30 | 01 | 02 | 03 | 04 | 05 |
The data presented here provided by IEM API webservice: daily.json. A simple CSV option exists as well.
Daily High/Low Plot
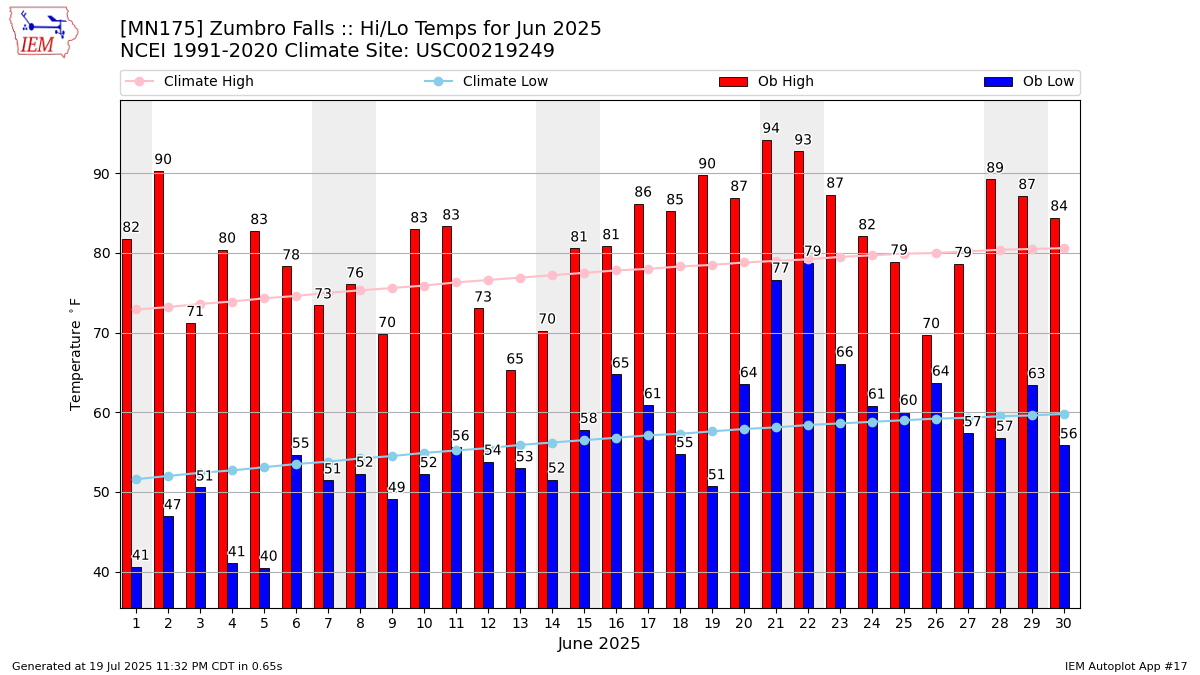
Description: This chart of the monthly temperature data. The bars are the observations and the dots are climatology.
Daily Rainfall
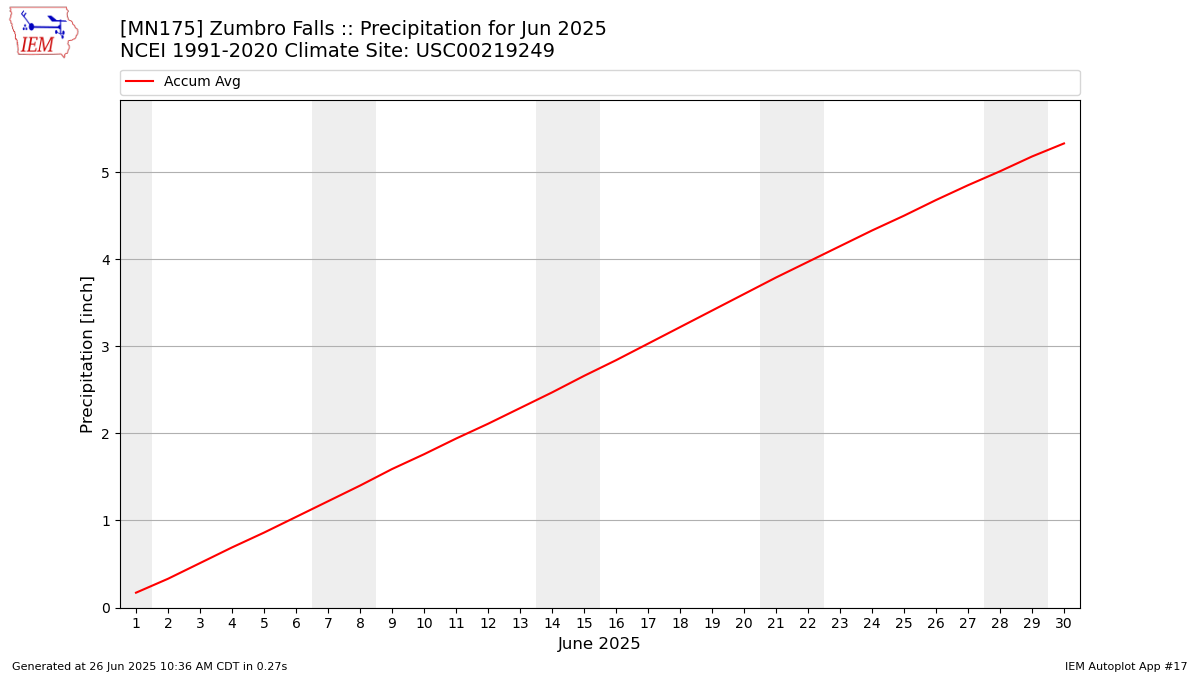
Description: This chart is of daily precipitation for the month. The red line would be an average month while the blue line and bars are observations.
Daily Average Wind Speeds

Description: This chart is of the daily average wind speeds.
The data presented here provided by IEM API webservice: daily.json. A simple CSV option exists as well.