| May 2025 | Jun 2025 | Jul 2025 | ||||
|---|---|---|---|---|---|---|
| Sunday | Monday | Tuesday | Wednesday | Thursday | Friday | Saturday |
| 01 High: 81.26961 Low: 40.420406 Precip: M Avg Wind: N @ 0.0 RH% Min/Max: 35-90 Feel Min/Max: 51 to 81 | 02 High: 88.0106 Low: 54.489223 Precip: M Avg Wind: N @ 0.0 RH% Min/Max: 30-94 Feel Min/Max: 54 to 86 | 03 High: 72.5396 Low: 52.14919 Precip: M Avg Wind: N @ 0.0 RH% Min/Max: 30-85 Feel Min/Max: 52 to 73 | 04 High: 74.29999 Low: 43.77019 Precip: M Avg Wind: N @ 0.0 RH% Min/Max: 27-89 Feel Min/Max: 50 to 74 | 05 High: 72.24082 Low: 42.4292 Precip: M Avg Wind: N @ 0.0 RH% Min/Max: 41-97 Feel Min/Max: 50 to 72 | 06 High: 73.25063 Low: 52.3598 Precip: M Avg Wind: N @ 0.0 RH% Min/Max: 37-91 Feel Min/Max: 52 to 73 | 07 High: 75.39082 Low: 44.160812 Precip: M Avg Wind: N @ 0.0 RH% Min/Max: 41-98 Feel Min/Max: 50 to 75 |
| 08 High: 62.810596 Low: 50.55079 Precip: M Avg Wind: N @ 0.0 RH% Min/Max: 57-97 Feel Min/Max: 51 to 63 | 09 High: 63.190395 Low: 49.33037 Precip: M Avg Wind: N @ 0.0 RH% Min/Max: 61-94 Feel Min/Max: 50 to 63 | 10 High: 76.1792 Low: 48.419605 Precip: M Avg Wind: N @ 0.0 RH% Min/Max: 40-94 Feel Min/Max: 50 to 76 | 11 High: 73.41081 Low: 51.769394 Precip: M Avg Wind: N @ 0.0 RH% Min/Max: 33-94 Feel Min/Max: 52 to 73 | 12 High: 68.12062 Low: 45.089596 Precip: M Avg Wind: N @ 0.0 RH% Min/Max: 43-96 Feel Min/Max: 50 to 68 | 13 High: 65.859795 Low: 44.659424 Precip: M Avg Wind: N @ 0.0 RH% Min/Max: 39-69 Feel Min/Max: 50 to 66 | 14 High: 69.29061 Low: 38.980427 Precip: M RH% Min/Max: 47-79 Feel Min/Max: 51 to 69 |
| 15 Precip: M | 16 | 17 | 18 | 19 | 20 | 21 |
| 22 | 23 | 24 | 25 | 26 | 27 | 28 |
| 29 | 30 | 01 | 02 | 03 | 04 | 05 |
The data presented here provided by IEM API webservice: daily.json. A simple CSV option exists as well.
Daily High/Low Plot
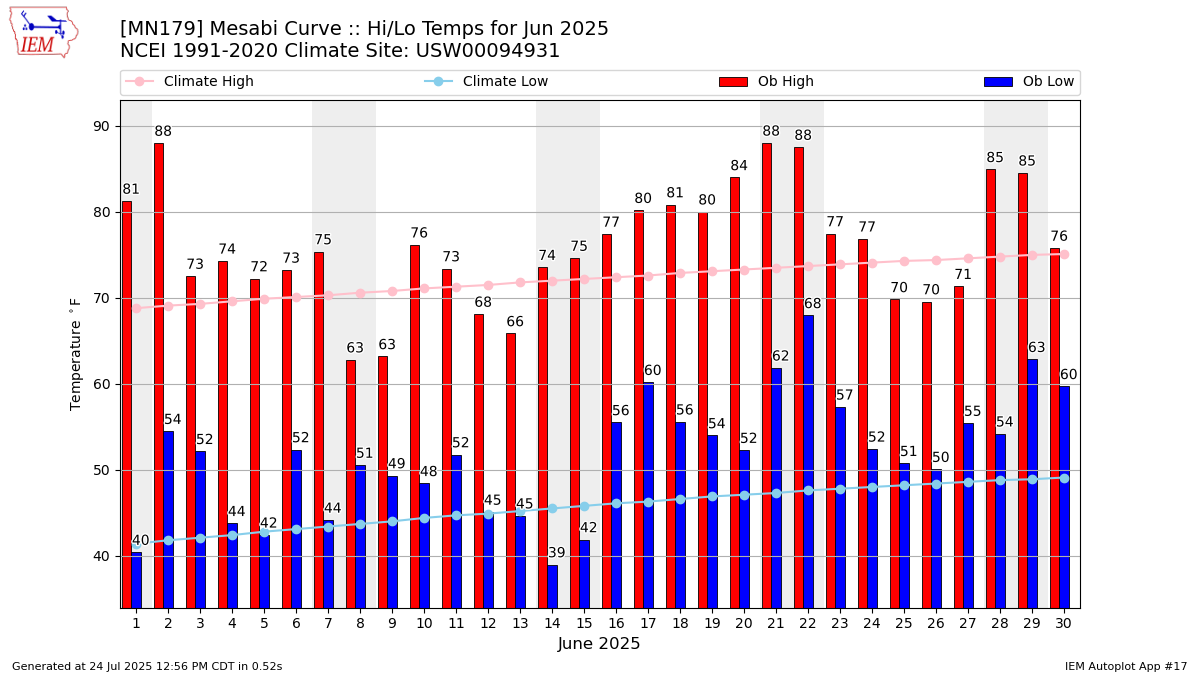
Description: This chart of the monthly temperature data. The bars are the observations and the dots are climatology.
Daily Rainfall

Description: This chart is of daily precipitation for the month. The red line would be an average month while the blue line and bars are observations.
Daily Average Wind Speeds
Description: This chart is of the daily average wind speeds.
The data presented here provided by IEM API webservice: daily.json. A simple CSV option exists as well.