| May 2025 | Jun 2025 | Jul 2025 | ||||
|---|---|---|---|---|---|---|
| Sunday | Monday | Tuesday | Wednesday | Thursday | Friday | Saturday |
| 01 High: 95.9 Low: 90.32 Precip: 0.17 Max Stage[ft]: 1869.04 RH% Min/Max: 78-78 Feel Min/Max: 113 to 135 | 02 High: 108.32 Low: 92.3 Precip: 0.04 Max Stage[ft]: 1869.22 RH% Min/Max: 78-78 Feel Min/Max: 120 to 199 | 03 High: 122 Low: 88.52 Precip: M Max Stage[ft]: 1869.21 RH% Min/Max: 78-78 Feel Min/Max: 107 to 192 | 04 High: 132.8 Low: 98.96 Precip: M Max Stage[ft]: 1869.10 RH% Min/Max: 78-78 Feel Min/Max: 150 to 196 | 05 High: 131.72 Low: 107.06 Precip: M Max Stage[ft]: 1868.89 RH% Min/Max: 78-78 Feel Min/Max: 195 to 199 | 06 High: 120.74 Low: 107.42 Precip: 0.06 Max Stage[ft]: 1868.63 RH% Min/Max: 78-78 Feel Min/Max: 197 to 197 | 07 High: 115.52 Low: 104.36 Precip: 0.08 Max Stage[ft]: 1868.44 RH% Min/Max: 78-78 Feel Min/Max: 179 to 198 |
| 08 High: 120.92 Low: 100.22 Precip: M Max Stage[ft]: 1868.34 RH% Min/Max: 78-78 Feel Min/Max: 156 to 197 | 09 High: 112.64 Low: 104.9 Precip: M Max Stage[ft]: 1868.18 RH% Min/Max: 78-78 Feel Min/Max: 182 to 199 | 10 High: 118.22 Low: 103.1 Precip: 0.02 Max Stage[ft]: 1868.07 RH% Min/Max: 78-78 Feel Min/Max: 171 to 199 | 11 High: 118.4 Low: 100.04 Precip: 0.01 Max Stage[ft]: 1867.96 RH% Min/Max: 78-78 Feel Min/Max: 155 to 197 | 12 High: 114.44 Low: 98.6 Precip: 0.12 Max Stage[ft]: 1867.84 RH% Min/Max: 78-78 Feel Min/Max: 148 to 198 | 13 High: 108.5 Low: 94.28 Precip: M Max Stage[ft]: 1867.78 RH% Min/Max: 78-78 Feel Min/Max: 128 to 198 | 14 High: 117.5 Low: 93.92 Precip: M Max Stage[ft]: 1867.71 RH% Min/Max: 78-78 Feel Min/Max: 127 to 194 |
| 15 High: 119.3 Low: 95.72 Precip: M Max Stage[ft]: 1867.63 RH% Min/Max: 78-78 Feel Min/Max: 135 to 199 | 16 High: 124.52 Low: 93.02 Precip: M Max Stage[ft]: 1867.54 RH% Min/Max: 78-78 Feel Min/Max: 123 to 166 | 17 High: 122 Low: 103.64 Precip: M Max Stage[ft]: 1867.44 RH% Min/Max: 78-78 Feel Min/Max: 174 to 194 | 18 High: 128.3 Low: 111.02 Precip: M Max Stage[ft]: 1867.35 RH% Min/Max: 78-78 | 19 High: 132.8 Low: 113.9 Precip: 0.25 Max Stage[ft]: 1867.26 RH% Min/Max: 78-78 | 20 High: 115.16 Low: 105.62 Precip: 0.90 Max Stage[ft]: 1867.31 RH% Min/Max: 78-78 Feel Min/Max: 186 to 198 | 21 High: 122.18 Low: 95.36 Precip: 0.01 Max Stage[ft]: 1867.36 RH% Min/Max: 78-78 Feel Min/Max: 133 to 197 |
| 22 High: 123.26 Low: 108.14 Precip: 0.19 Max Stage[ft]: 1867.33 RH% Min/Max: 78-78 | 23 High: 137.84 Low: 109.22 Precip: M Max Stage[ft]: 1867.31 RH% Min/Max: 78-78 | 24 High: 136.22 Low: 115.7 Precip: M Max Stage[ft]: 1867.25 RH% Min/Max: 78-78 | 25 High: 126.5 Low: 102.92 Precip: M Max Stage[ft]: 1867.17 RH% Min/Max: 78-78 Feel Min/Max: 170 to 194 | 26 High: 116.96 Low: 98.78 Precip: M Max Stage[ft]: 1867.07 RH% Min/Max: 78-78 Feel Min/Max: 149 to 196 | 27 High: 120.02 Low: 95 Precip: 0.24 Max Stage[ft]: 1866.96 RH% Min/Max: 78-78 Feel Min/Max: 131 to 195 | 28 High: 104.9 Low: 101.48 Precip: 0.51 Max Stage[ft]: 1866.88 RH% Min/Max: 78-78 Feel Min/Max: 163 to 182 |
| 29 Precip: M | 30 | 01 | 02 | 03 | 04 | 05 |
The data presented here provided by IEM API webservice: daily.json. A simple CSV option exists as well.
Daily High/Low Plot
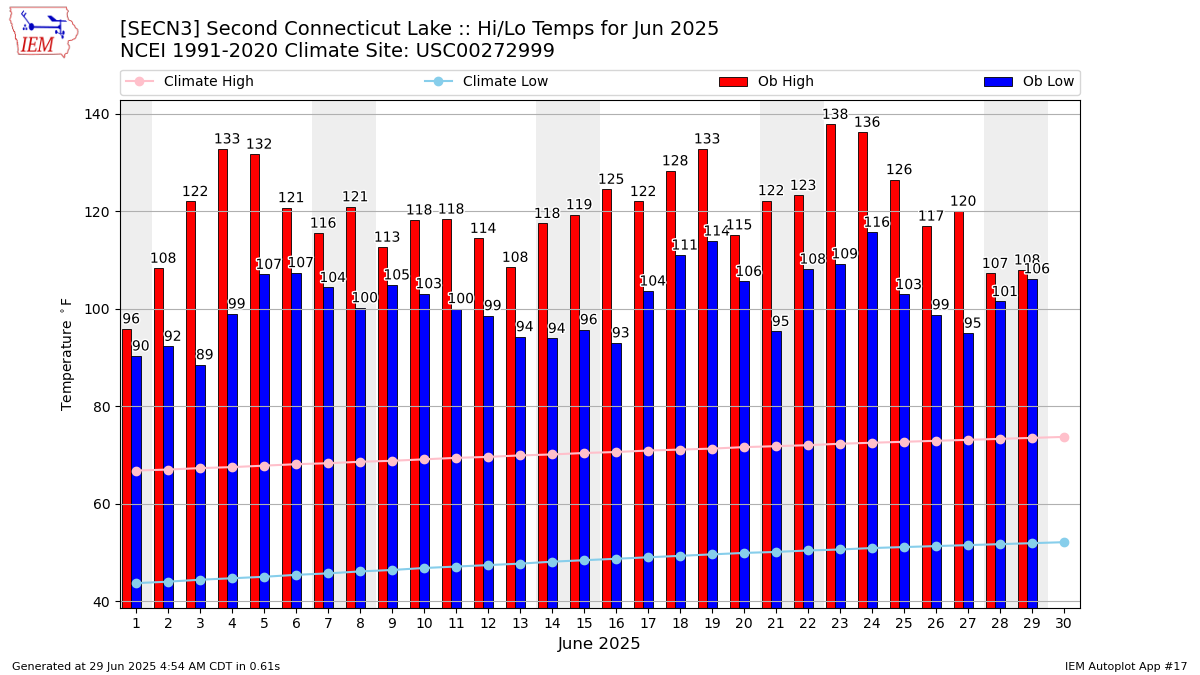
Description: This chart of the monthly temperature data. The bars are the observations and the dots are climatology.
Daily Rainfall
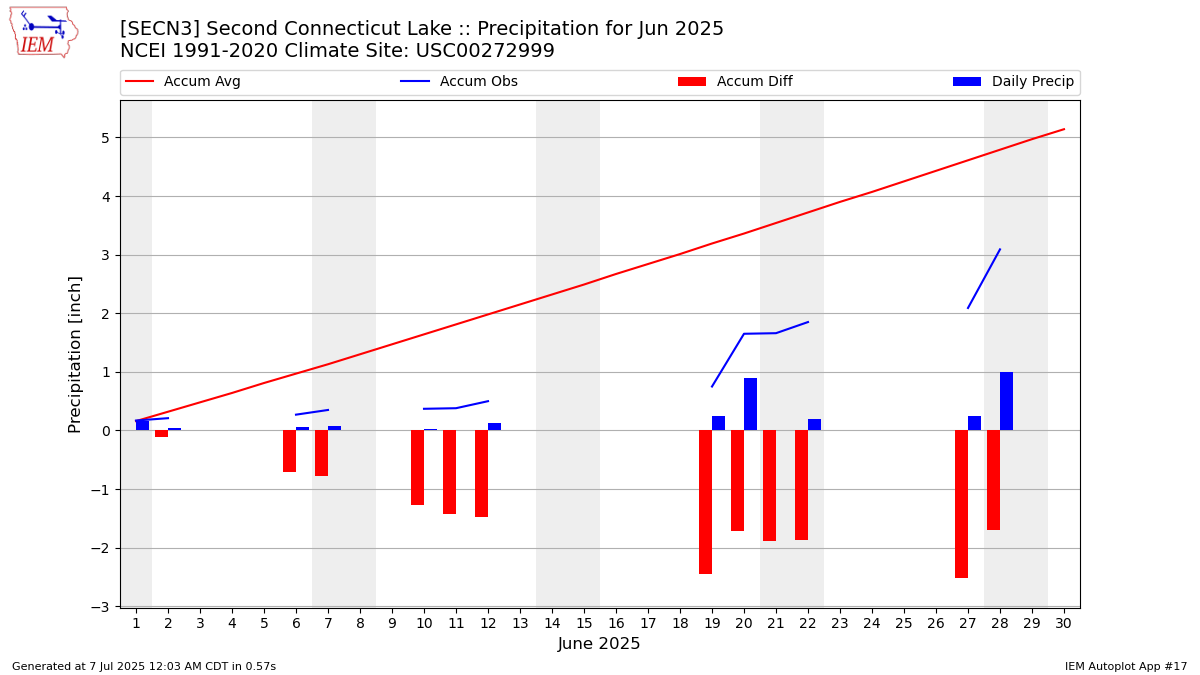
Description: This chart is of daily precipitation for the month. The red line would be an average month while the blue line and bars are observations.
Daily Average Wind Speeds

Description: This chart is of the daily average wind speeds.
The data presented here provided by IEM API webservice: daily.json. A simple CSV option exists as well.