| May 2025 | Jun 2025 | Jul 2025 | ||||
|---|---|---|---|---|---|---|
| Sunday | Monday | Tuesday | Wednesday | Thursday | Friday | Saturday |
| 01 Precip: M | 02 Precip: M | 03 Precip: 0.00 | 04 Precip: 0.00 | 05 Precip: 0.00 | 06 Precip: 0.00 | 07 Precip: 0.00 |
| 08 Precip: 0.00 | 09 Precip: 0.00 | 10 Precip: 0.00 | 11 Precip: 0.00 RH% Min/Max: 150-150 | 12 Precip: 0.00 | 13 High: 730.62 Low: 41.42 Precip: M RH% Min/Max: 215-406 | 14 High: 231.54 Low: 231.54 Precip: M RH% Min/Max: 460-460 |
| 15 High: 540.93 Low: 261.03 Precip: 0.00 RH% Min/Max: 96-96 | 16 High: 853.4 Low: 853.4 Precip: M | 17 High: 191.05 Low: 191.05 Precip: M | 18 High: 399.66 Low: 399.66 Precip: M | 19 Precip: M | 20 High: 242.98 Low: 242.98 Precip: M RH% Min/Max: 327-327 | 21 High: 584.94 Low: 148.36 Precip: M RH% Min/Max: 417-417 |
| 22 High: 687.93 Low: 687.93 Precip: M RH% Min/Max: 83-83 | 23 High: 209.98 Low: 209.98 Precip: M | 24 High: 195.01 Low: 195.01 Precip: M RH% Min/Max: 378-378 | 25 High: 407.14 Low: 407.14 Precip: 0.00 RH% Min/Max: 278-278 | 26 Precip: M RH% Min/Max: 261-261 | 27 High: 520.69 Low: 26.9 Precip: 0.00 RH% Min/Max: 152-152 | 28 High: 736.34 Low: 321.76 Precip: M |
| 29 High: 22.93 Low: 22.93 Precip: 0.00 RH% Min/Max: 52-242 | 30 High: -30.76 Low: -30.76 Precip: 0.00 | 01 | 02 | 03 | 04 | 05 |
The data presented here provided by IEM API webservice: daily.json. A simple CSV option exists as well.
Daily High/Low Plot
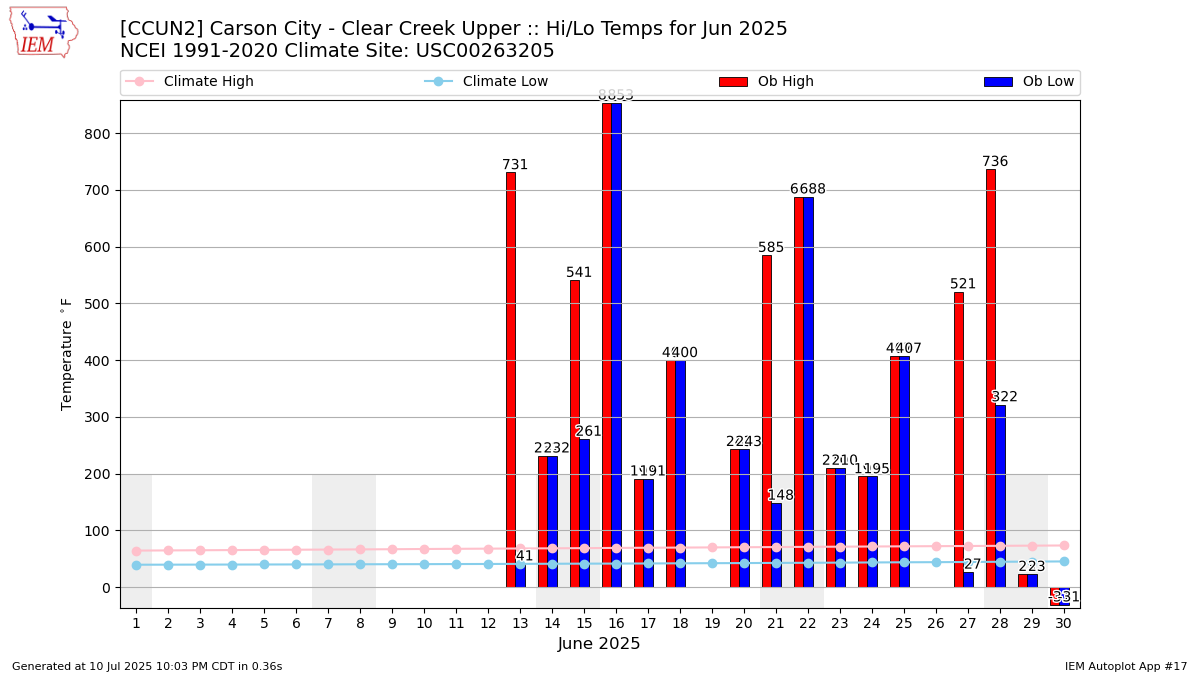
Description: This chart of the monthly temperature data. The bars are the observations and the dots are climatology.
Daily Rainfall

Description: This chart is of daily precipitation for the month. The red line would be an average month while the blue line and bars are observations.
Daily Average Wind Speeds
Description: This chart is of the daily average wind speeds.
The data presented here provided by IEM API webservice: daily.json. A simple CSV option exists as well.