| May 2025 | Jun 2025 | Jul 2025 | ||||
|---|---|---|---|---|---|---|
| Sunday | Monday | Tuesday | Wednesday | Thursday | Friday | Saturday |
| 01 High: 80.49919 Low: 42.960224 Precip: M Avg Wind: WSW @ 4.5 Gust: 30 (8:50 PM) RH% Min/Max: 16-68 Feel Min/Max: 43 to 80 | 02 High: 65.33059 Low: 42.400417 Precip: M Avg Wind: W @ 7.3 Gust: 28 (3:50 PM) RH% Min/Max: 13-61 Feel Min/Max: 40 to 65 | 03 High: 58.49962 Low: 32.300575 Precip: M Avg Wind: W @ 3.5 Gust: 25 (6:30 PM) RH% Min/Max: 30-67 Feel Min/Max: 32 to 58 | 04 High: 65.64919 Low: 32.2808 Precip: M Avg Wind: WSW @ 3.4 Gust: 24 (1:40 PM) RH% Min/Max: 18-71 Feel Min/Max: 32 to 66 | 05 High: 64.31001 Low: 34.0808 Precip: M Avg Wind: WSW @ 3.3 Gust: 24 (2:40 PM) RH% Min/Max: 20-70 Feel Min/Max: 34 to 64 | 06 High: 67.080215 Low: 39.46998 Precip: M Avg Wind: W @ 4.4 Gust: 28 (3:50 PM) RH% Min/Max: 24-70 Feel Min/Max: 37 to 67 | 07 High: 72.12019 Low: 39.810226 Precip: M Avg Wind: WSW @ 6.4 Gust: 30 (2:00 PM) RH% Min/Max: 27-66 Feel Min/Max: 40 to 72 |
| 08 High: 76.06939 Low: 40.44919 Precip: M Avg Wind: W @ 3.4 Gust: 23 (5:40 PM) RH% Min/Max: 26-70 Feel Min/Max: 40 to 76 | 09 High: 80.09962 Low: 42.110596 Precip: M Avg Wind: NW @ 2.6 Gust: 19 (4:10 PM) RH% Min/Max: 14-69 Feel Min/Max: 42 to 80 | 10 High: 77.210594 Low: 43.32019 Precip: M Avg Wind: W @ 4.4 Gust: 28 (4:30 PM) RH% Min/Max: 16-68 Feel Min/Max: 43 to 77 | 11 High: 79.26081 Low: 46.209213 Precip: M Avg Wind: WSW @ 4.5 Gust: 33 (5:30 PM) RH% Min/Max: 22-66 Feel Min/Max: 46 to 79 | 12 High: 79.73058 Low: 42.960224 Precip: M Avg Wind: SW @ 3.4 Gust: 26 (6:10 PM) RH% Min/Max: 22-69 Feel Min/Max: 43 to 80 | 13 High: 79.44082 Low: 46.29919 Precip: M Avg Wind: WSW @ 3.9 Gust: 33 (6:00 PM) RH% Min/Max: 17-67 Feel Min/Max: 46 to 79 | 14 High: 79.62078 Low: 44.299404 Precip: M Avg Wind: W @ 3.5 Gust: 26 (3:20 PM) RH% Min/Max: 16-64 Feel Min/Max: 44 to 80 |
| 15 High: 80.20042 Low: 46.95079 Precip: M Avg Wind: WSW @ 5.4 Gust: 29 (1:30 PM) RH% Min/Max: 12-60 Feel Min/Max: 47 to 80 | 16 High: 78.76038 Low: 43.71982 Precip: M Avg Wind: S @ 2.3 Gust: 18 (3:40 PM) RH% Min/Max: 14-59 Feel Min/Max: 44 to 79 | 17 High: 62.96001 Low: 42.319393 Precip: M Gust: 19 (10:00 AM) RH% Min/Max: 29-62 Feel Min/Max: 42 to 63 | 18 Precip: M | 19 | 20 | 21 |
| 22 | 23 | 24 | 25 | 26 | 27 | 28 |
| 29 | 30 | 01 | 02 | 03 | 04 | 05 |
The data presented here provided by IEM API webservice: daily.json. A simple CSV option exists as well.
Daily High/Low Plot
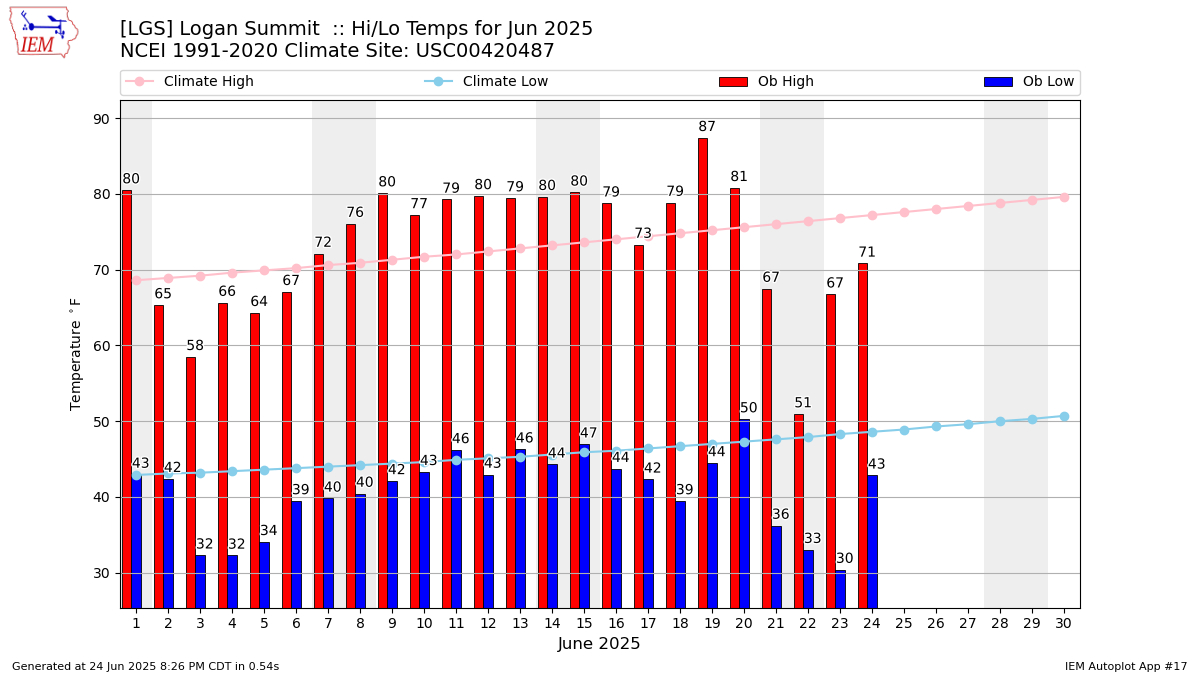
Description: This chart of the monthly temperature data. The bars are the observations and the dots are climatology.
Daily Rainfall
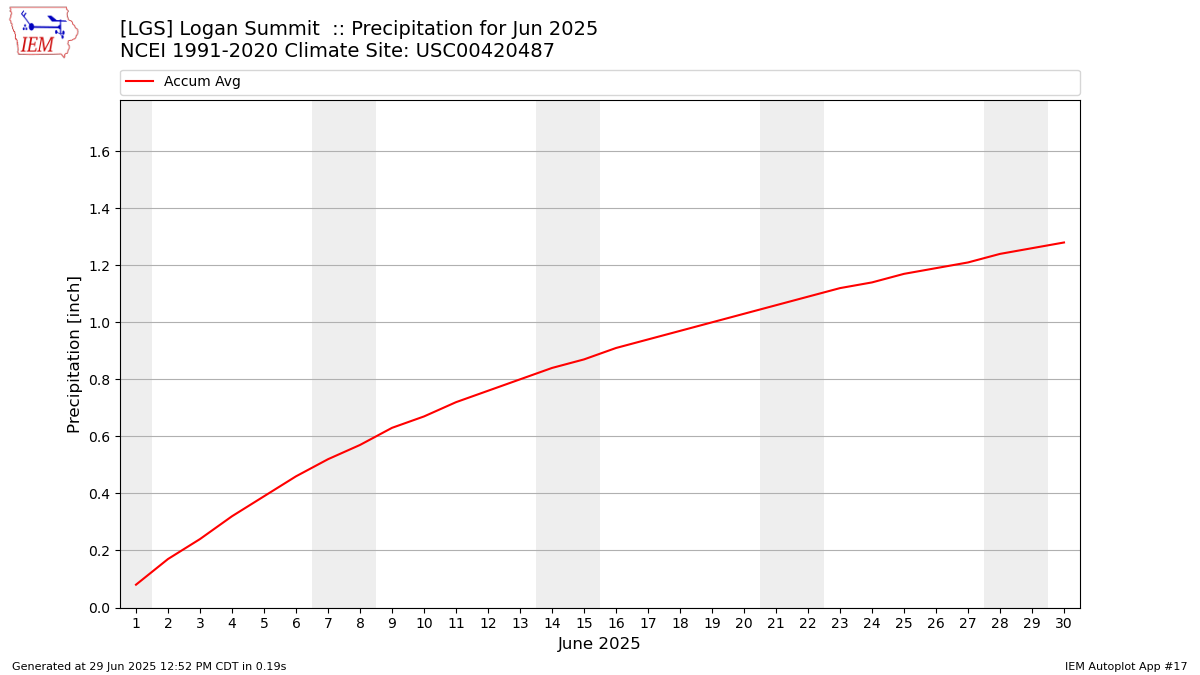
Description: This chart is of daily precipitation for the month. The red line would be an average month while the blue line and bars are observations.
Daily Average Wind Speeds
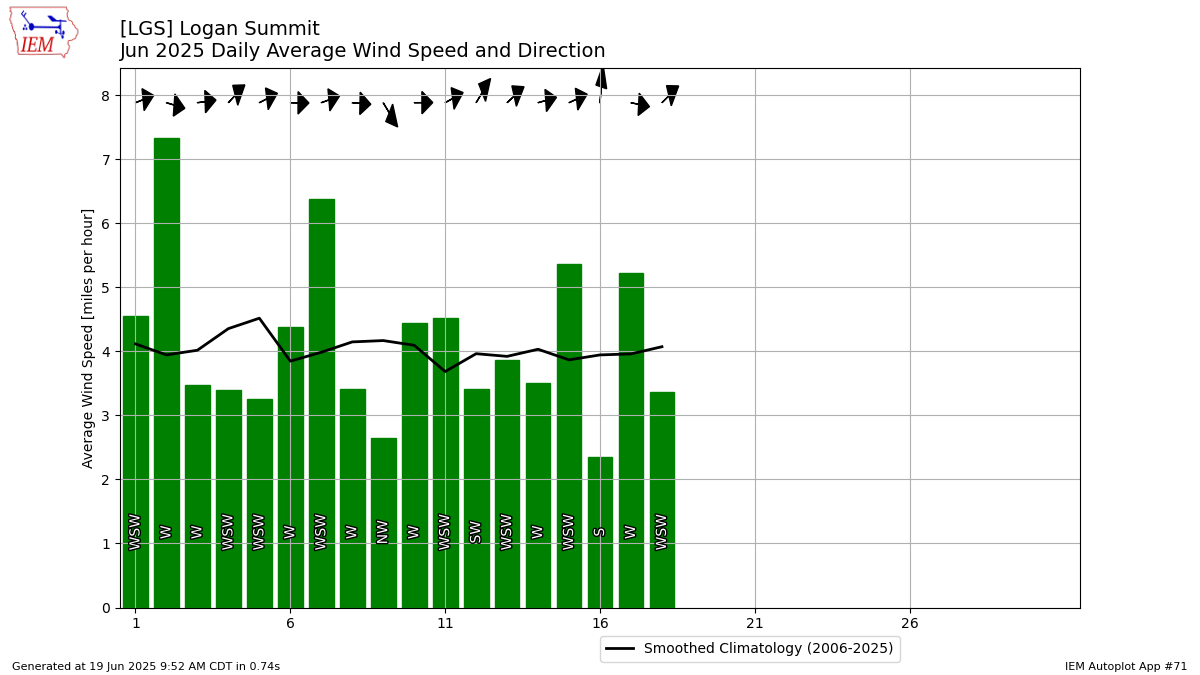
Description: This chart is of the daily average wind speeds.
The data presented here provided by IEM API webservice: daily.json. A simple CSV option exists as well.