| May 2025 | Jun 2025 | Jul 2025 | ||||
|---|---|---|---|---|---|---|
| Sunday | Monday | Tuesday | Wednesday | Thursday | Friday | Saturday |
| 01 High: 82.2002 Low: 35.04919 Precip: M Avg Wind: W @ 4.8 Gust: 23 (5:20 PM) RH% Min/Max: 15-87 Feel Min/Max: 35 to 80 | 02 High: 72.06982 Low: 33.679413 Precip: M Avg Wind: W @ 6.9 Gust: 31 (2:00 PM) RH% Min/Max: 19-80 Feel Min/Max: 34 to 72 | 03 High: 62.69002 Low: 30.410597 Precip: M Avg Wind: WSW @ 7.7 Gust: 30 (4:30 PM) RH% Min/Max: 27-82 Feel Min/Max: 27 to 63 | 04 High: 67.080215 Low: 26.119392 Precip: M Avg Wind: W @ 6.3 Gust: 30 (3:50 PM) RH% Min/Max: 26-83 Feel Min/Max: 23 to 67 | 05 High: 67.53922 Low: 26.96001 Precip: M Avg Wind: W @ 5.5 Gust: 25 (5:10 PM) RH% Min/Max: 22-86 Feel Min/Max: 23 to 68 | 06 High: 67.99999 Low: 34.80079 Precip: M Avg Wind: W @ 7.1 Gust: 31 (3:00 PM) RH% Min/Max: 24-75 Feel Min/Max: 28 to 68 | 07 High: 73.1606 Low: 30.909212 Precip: M Avg Wind: WSW @ 6.9 Gust: 30 (2:40 PM) RH% Min/Max: 25-77 Feel Min/Max: 26 to 73 |
| 08 High: 77.63 Low: 36.319977 Precip: M Avg Wind: W @ 5.8 Gust: 27 (2:10 PM) RH% Min/Max: 20-84 Feel Min/Max: 33 to 78 | 09 High: 81.10042 Low: 38.730213 Precip: M Avg Wind: N @ 5.1 Gust: 37 (7:50 PM) RH% Min/Max: 10-82 Feel Min/Max: 36 to 80 | 10 High: 81.3002 Low: 40.44919 Precip: M Avg Wind: WSW @ 6.0 Gust: 29 (3:50 PM) RH% Min/Max: 20-75 Feel Min/Max: 36 to 80 | 11 High: 84.000206 Low: 43.300415 Precip: M Avg Wind: WSW @ 8.9 Gust: 33 (4:50 AM) RH% Min/Max: 19-77 Feel Min/Max: 43 to 81 | 12 High: 81.49999 Low: 44.07979 Precip: M Avg Wind: WSW @ 6.8 Gust: 31 (4:20 PM) RH% Min/Max: 17-87 Feel Min/Max: 40 to 80 | 13 High: 82.500786 Low: 39.230587 Precip: M Avg Wind: WSW @ 7.7 Gust: 31 (4:30 PM) RH% Min/Max: 12-81 Feel Min/Max: 38 to 80 | 14 High: 82.29919 Low: 35.229202 Precip: M Avg Wind: WSW @ 7.2 Gust: 30 (2:40 PM) RH% Min/Max: 11-77 Feel Min/Max: 32 to 80 |
| 15 High: 82.90041 Low: 37.720406 Precip: M Avg Wind: W @ 6.5 Gust: 31 (3:00 PM) RH% Min/Max: 11-76 Feel Min/Max: 36 to 80 | 16 High: 80.49919 Low: 33.319393 Precip: M Avg Wind: W @ 6.0 Gust: 27 (4:00 PM) RH% Min/Max: 17-78 Feel Min/Max: 33 to 80 | 17 High: 74.22979 Low: 42.310383 Precip: M Gust: 34 (2:10 AM) RH% Min/Max: 20-69 Feel Min/Max: 41 to 74 | 18 Precip: M | 19 | 20 | 21 |
| 22 | 23 | 24 | 25 | 26 | 27 | 28 |
| 29 | 30 | 01 | 02 | 03 | 04 | 05 |
The data presented here provided by IEM API webservice: daily.json. A simple CSV option exists as well.
Daily High/Low Plot
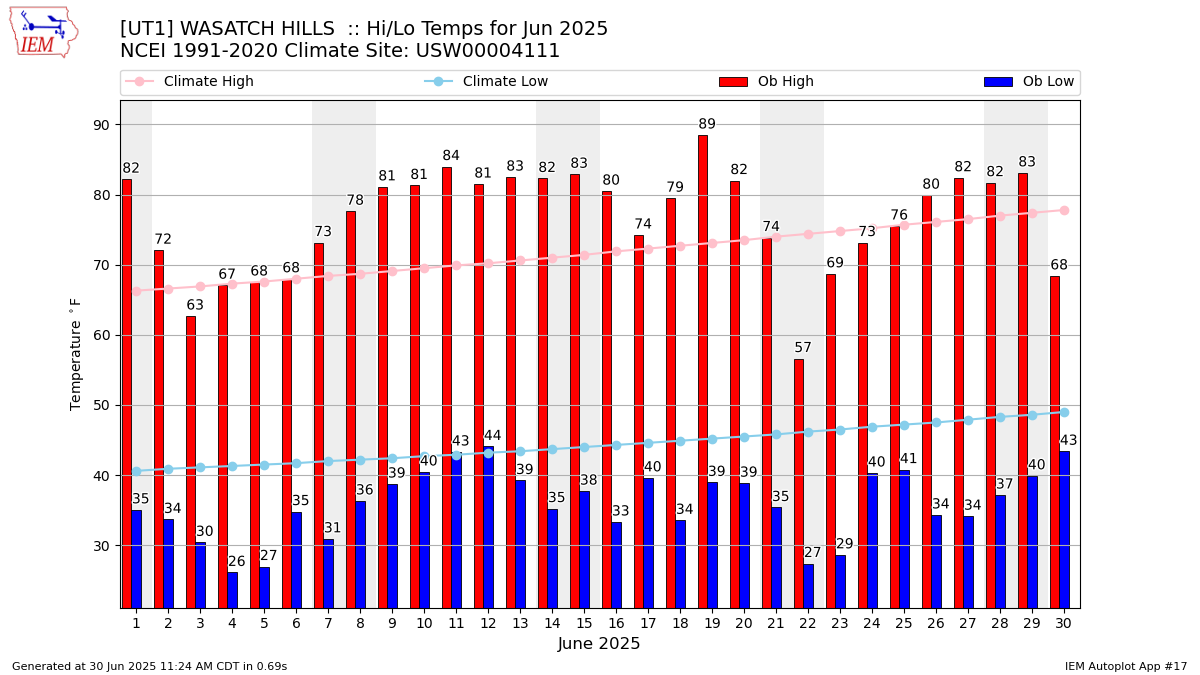
Description: This chart of the monthly temperature data. The bars are the observations and the dots are climatology.
Daily Rainfall
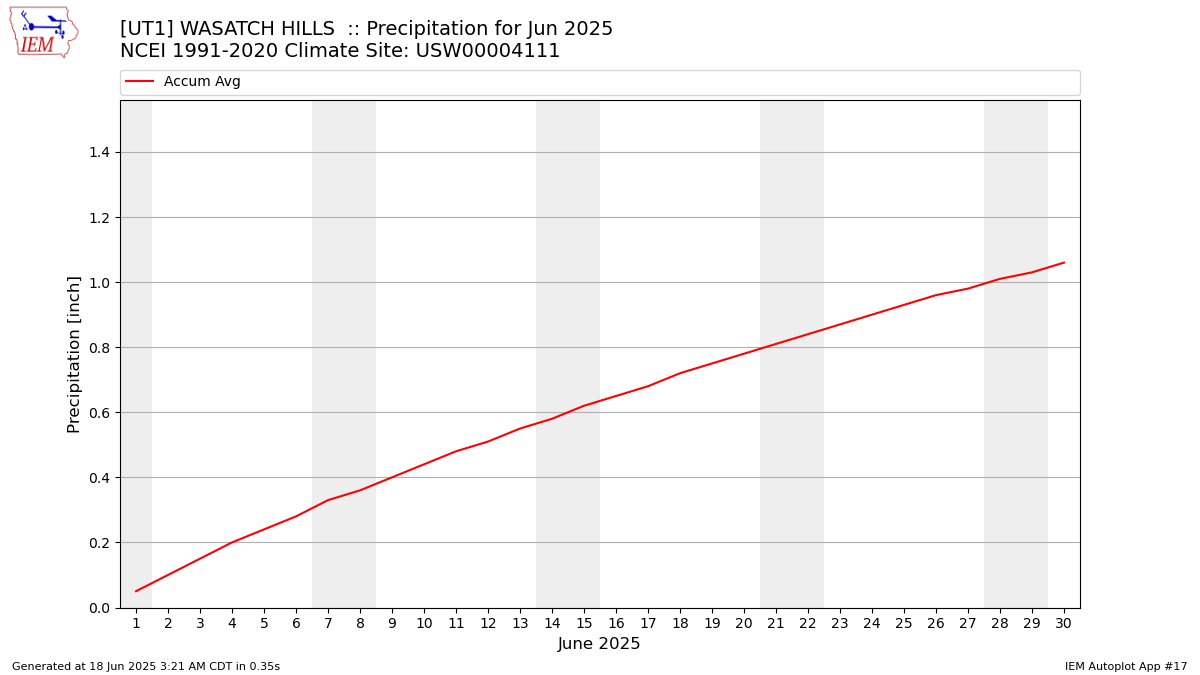
Description: This chart is of daily precipitation for the month. The red line would be an average month while the blue line and bars are observations.
Daily Average Wind Speeds
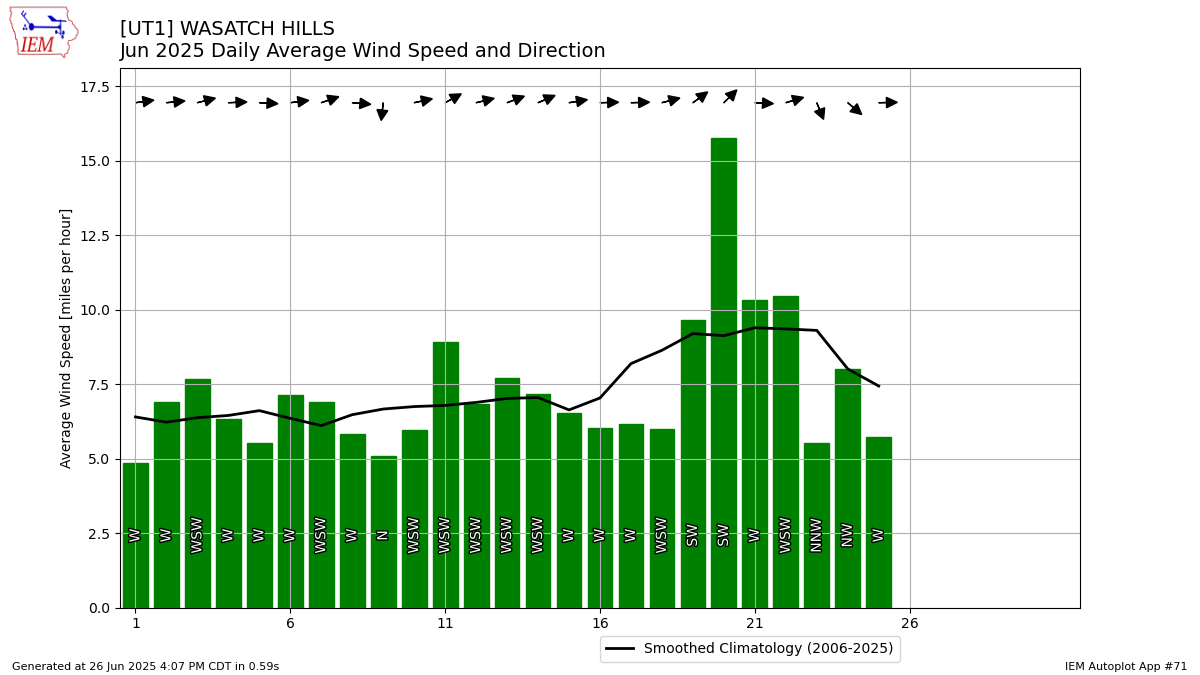
Description: This chart is of the daily average wind speeds.
The data presented here provided by IEM API webservice: daily.json. A simple CSV option exists as well.