| May 2025 | Jun 2025 | Jul 2025 | ||||
|---|---|---|---|---|---|---|
| Sunday | Monday | Tuesday | Wednesday | Thursday | Friday | Saturday |
| 01 High: 65.24061 Low: 50.01081 Precip: M Avg Wind: W @ 4.3 Gust: 25 (4:20 PM) RH% Min/Max: 27-58 Feel Min/Max: 50 to 65 | 02 High: 51.279785 Low: 42.9494 Precip: M Avg Wind: W @ 3.0 Gust: 14 (3:40 PM) RH% Min/Max: 56-100 Feel Min/Max: 43 to 51 | 03 High: 57.390823 Low: 43.509212 Precip: M Avg Wind: W @ 6.1 Gust: 22 (3:40 PM) RH% Min/Max: 33-91 Feel Min/Max: 39 to 57 | 04 High: 53.360596 Low: 38.85079 Precip: M Avg Wind: WSW @ 5.2 Gust: 28 (5:40 PM) RH% Min/Max: 54-89 Feel Min/Max: 32 to 53 | 05 High: 52.419178 Low: 35.72062 Precip: M Avg Wind: WSW @ 4.7 Gust: 21 (4:20 PM) RH% Min/Max: 57-98 Feel Min/Max: 32 to 52 | 06 High: 52.469604 Low: 38.4494 Precip: M Avg Wind: W @ 3.5 Gust: 17 (3:40 PM) RH% Min/Max: 57-97 Feel Min/Max: 38 to 52 | 07 High: 61.80079 Low: 40.929787 Precip: M Avg Wind: W @ 2.9 Gust: 15 (12:20 PM) RH% Min/Max: 37-79 Feel Min/Max: 41 to 62 |
| 08 High: 58.879414 Low: 47.66001 Precip: M Avg Wind: SW @ 2.2 Gust: 17 (5:20 PM) RH% Min/Max: 35-59 Feel Min/Max: 48 to 59 | 09 High: 67.04061 Low: 49.859585 Precip: M Avg Wind: SSE @ 6.1 Gust: 26 (4:30 PM) RH% Min/Max: 22-48 Feel Min/Max: 48 to 67 | 10 High: 67.949615 Low: 49.49061 Precip: M Avg Wind: WSW @ 5.1 Gust: 26 (4:00 PM) RH% Min/Max: 26-70 Feel Min/Max: 48 to 68 | 11 High: 66.95959 Low: 48.63922 Precip: M Avg Wind: W @ 5.8 Gust: 35 (3:50 PM) RH% Min/Max: 23-60 Feel Min/Max: 49 to 67 | 12 High: 65.44039 Low: 51.940395 Precip: M Avg Wind: W @ 6.7 Gust: 30 (5:00 PM) RH% Min/Max: 21-34 Feel Min/Max: 52 to 65 | 13 High: 63.669178 Low: 43.379627 Precip: M Avg Wind: W @ 5.9 Gust: 29 (2:30 PM) RH% Min/Max: 21-42 Feel Min/Max: 43 to 64 | 14 High: 67.04061 Low: 48.16939 Precip: M Avg Wind: W @ 4.9 Gust: 19 (2:20 PM) RH% Min/Max: 18-30 Feel Min/Max: 48 to 67 |
| 15 High: 68.109795 Low: 51.459797 Precip: M Avg Wind: W @ 4.2 Gust: 24 (5:20 PM) RH% Min/Max: 11-24 Feel Min/Max: 51 to 68 | 16 High: 59.61918 Low: 48.599617 Precip: M Gust: 11 (8:10 AM) RH% Min/Max: 11-24 Feel Min/Max: 49 to 60 | 17 Precip: M | 18 | 19 | 20 | 21 |
| 22 | 23 | 24 | 25 | 26 | 27 | 28 |
| 29 | 30 | 01 | 02 | 03 | 04 | 05 |
The data presented here provided by IEM API webservice: daily.json. A simple CSV option exists as well.
Daily High/Low Plot
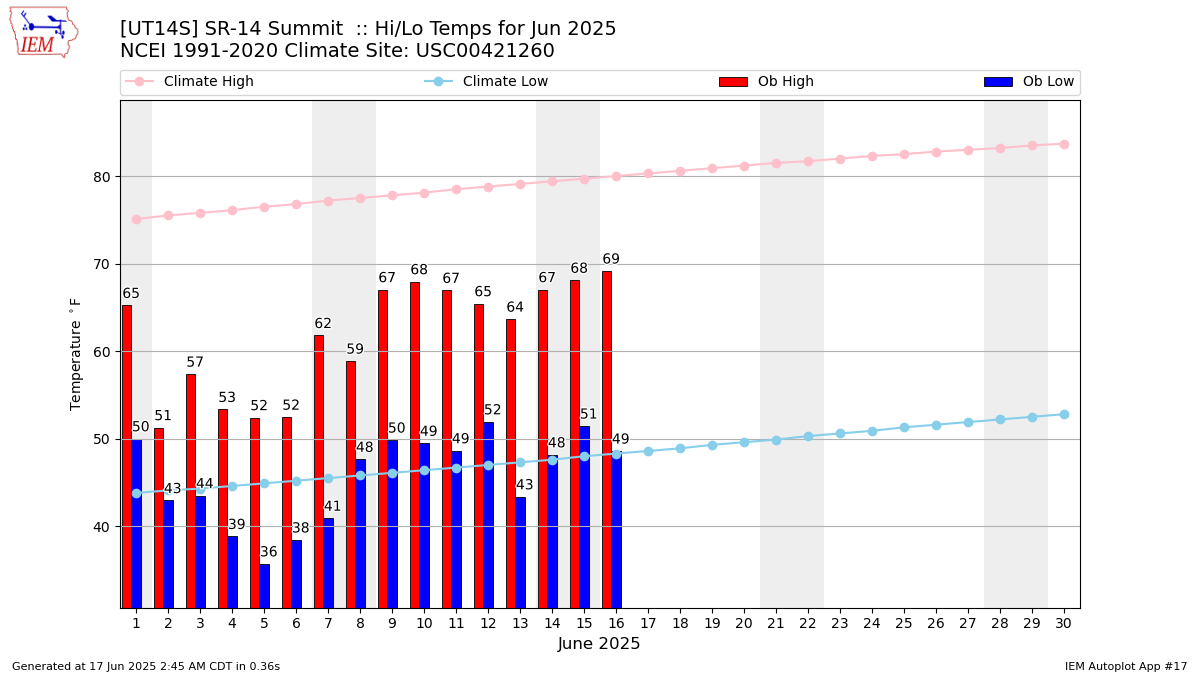
Description: This chart of the monthly temperature data. The bars are the observations and the dots are climatology.
Daily Rainfall
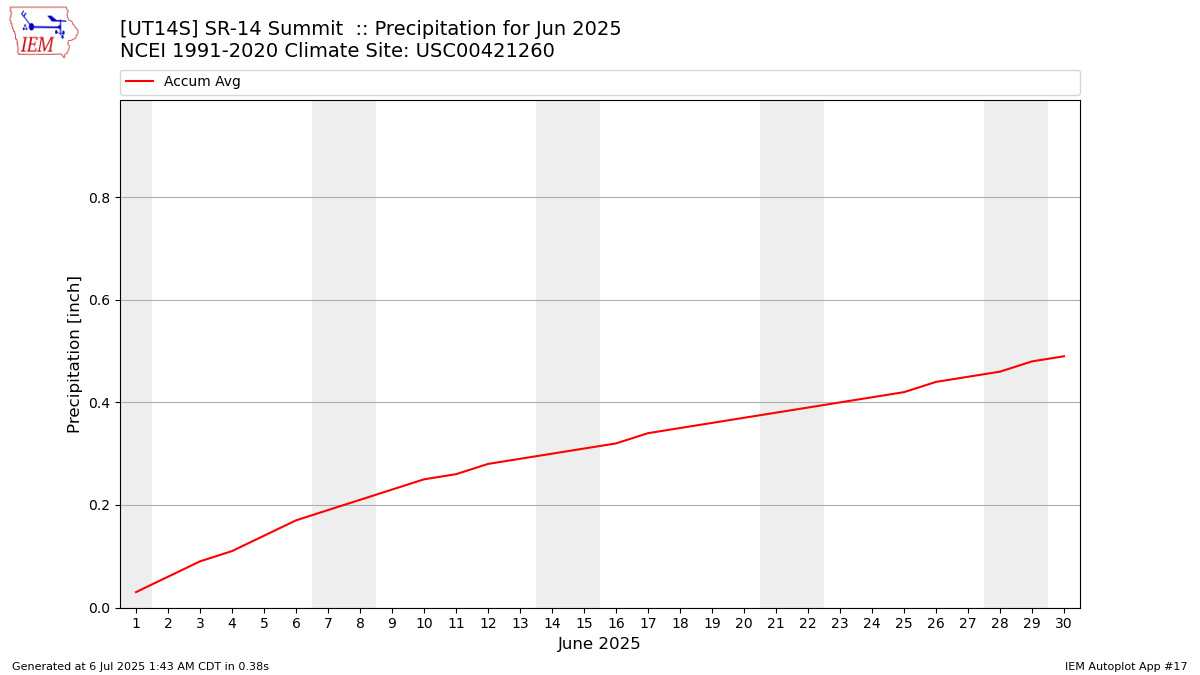
Description: This chart is of daily precipitation for the month. The red line would be an average month while the blue line and bars are observations.
Daily Average Wind Speeds
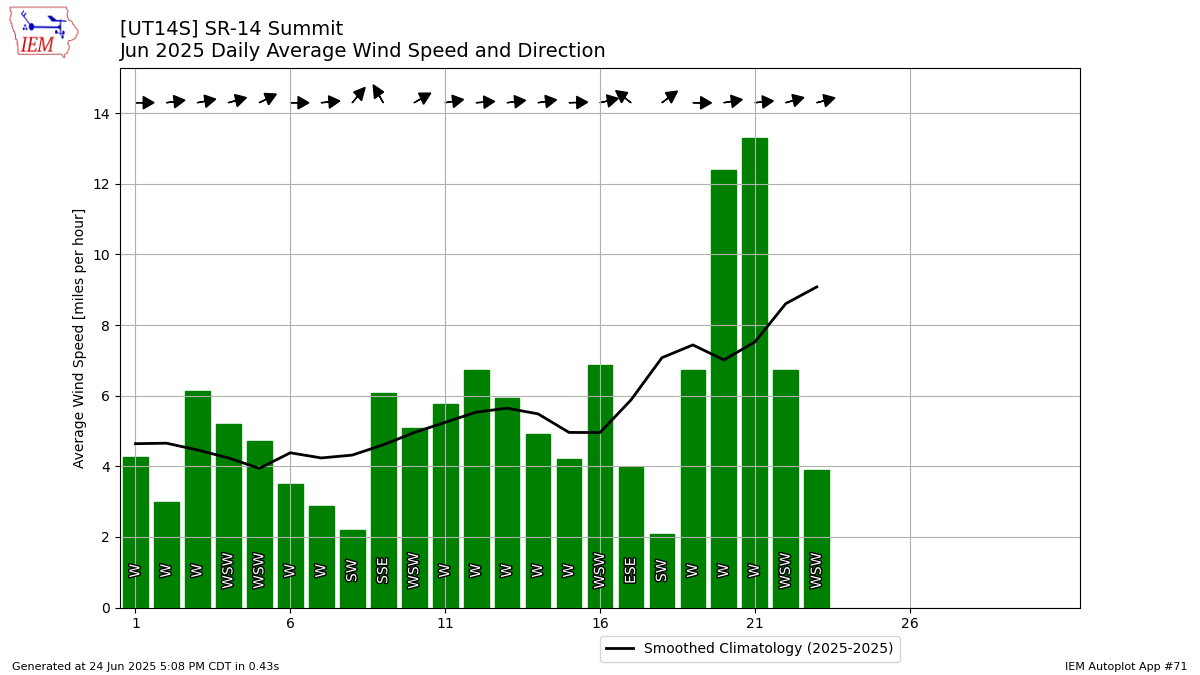
Description: This chart is of the daily average wind speeds.
The data presented here provided by IEM API webservice: daily.json. A simple CSV option exists as well.