| May 2025 | Jun 2025 | Jul 2025 | ||||
|---|---|---|---|---|---|---|
| Sunday | Monday | Tuesday | Wednesday | Thursday | Friday | Saturday |
| 01 High: 83.40079 Low: 53.349777 Precip: M Avg Wind: WSW @ 4.3 Gust: 18 (10:00 PM) RH% Min/Max: 12-47 Feel Min/Max: 53 to 81 | 02 High: 71.31023 Low: 50.709213 Precip: M Avg Wind: WSW @ 4.6 Gust: 17 (4:55 PM) RH% Min/Max: 17-54 Feel Min/Max: 51 to 71 | 03 High: 62.900574 Low: 44.470406 Precip: M Avg Wind: WSW @ 4.9 Gust: 19 (1:00 PM) RH% Min/Max: 20-42 Feel Min/Max: 43 to 63 | 04 High: 66.52041 Low: 43.300415 Precip: M Avg Wind: WSW @ 3.8 Gust: 15 (1:45 PM) RH% Min/Max: 25-49 Feel Min/Max: 42 to 67 | 05 High: 68.77941 Low: 40.580585 Precip: M Avg Wind: W @ 3.3 Gust: 14 (2:30 PM) RH% Min/Max: 24-53 Feel Min/Max: 39 to 69 | 06 High: 69.029625 Low: 47.370193 Precip: M Avg Wind: WSW @ 4.0 Gust: 19 (4:35 PM) RH% Min/Max: 19-54 Feel Min/Max: 47 to 69 | 07 High: 73.81939 Low: 48.680588 Precip: M Avg Wind: WSW @ 4.6 Gust: 16 (2:15 PM) RH% Min/Max: 20-41 Feel Min/Max: 48 to 74 |
| 08 High: 79.0106 Low: 52.309425 Precip: M Avg Wind: WSW @ 4.2 Gust: 16 (2:35 PM) RH% Min/Max: 17-48 Feel Min/Max: 52 to 79 | 09 High: 81.39919 Low: 51.839596 Precip: M Avg Wind: NE @ 2.7 Gust: 10 (4:50 PM) RH% Min/Max: 11-58 Feel Min/Max: 52 to 80 | 10 High: 82.29919 Low: 55.720406 Precip: M Avg Wind: WNW @ 3.5 Gust: 14 (3:30 PM) RH% Min/Max: 18-41 Feel Min/Max: 56 to 80 | 11 High: 84.9002 Low: 57.09018 Precip: M Avg Wind: WSW @ 3.8 Gust: 19 (3:55 PM) RH% Min/Max: 15-55 Feel Min/Max: 57 to 82 | 12 High: 82.70058 Low: 52.66939 Precip: M Avg Wind: NE @ 3.2 Gust: 13 (2:05 PM) RH% Min/Max: 14-71 Feel Min/Max: 53 to 80 | 13 High: 83.699615 Low: 56.21001 Precip: M Avg Wind: SW @ 3.1 Gust: 17 (4:15 PM) RH% Min/Max: 8-53 Feel Min/Max: 56 to 80 | 14 High: 84.7994 Low: 58.870407 Precip: M Avg Wind: WSW @ 3.1 Gust: 16 (3:50 PM) RH% Min/Max: 9-32 Feel Min/Max: 59 to 81 |
| 15 High: 84.9002 Low: 61.930428 Precip: M Avg Wind: WSW @ 3.3 Gust: 12 (1:10 PM) RH% Min/Max: 9-31 Feel Min/Max: 62 to 82 | 16 Precip: M | 17 Precip: M | 18 | 19 | 20 | 21 |
| 22 | 23 | 24 | 25 | 26 | 27 | 28 |
| 29 | 30 | 01 | 02 | 03 | 04 | 05 |
The data presented here provided by IEM API webservice: daily.json. A simple CSV option exists as well.
Daily High/Low Plot
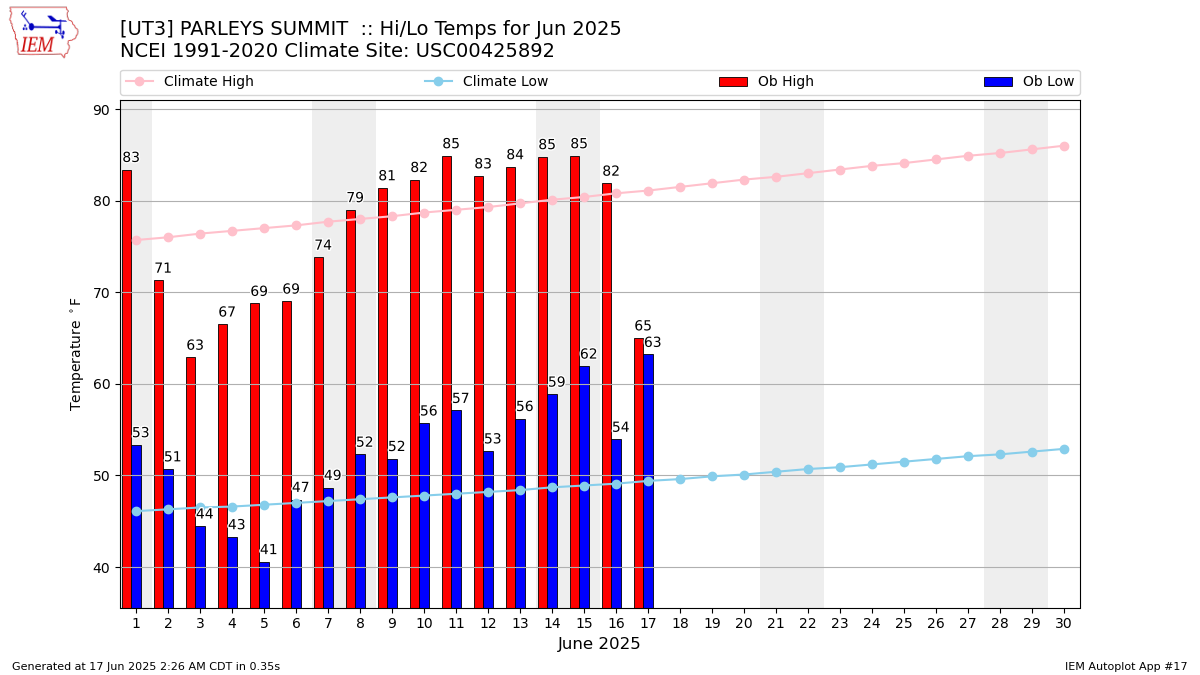
Description: This chart of the monthly temperature data. The bars are the observations and the dots are climatology.
Daily Rainfall
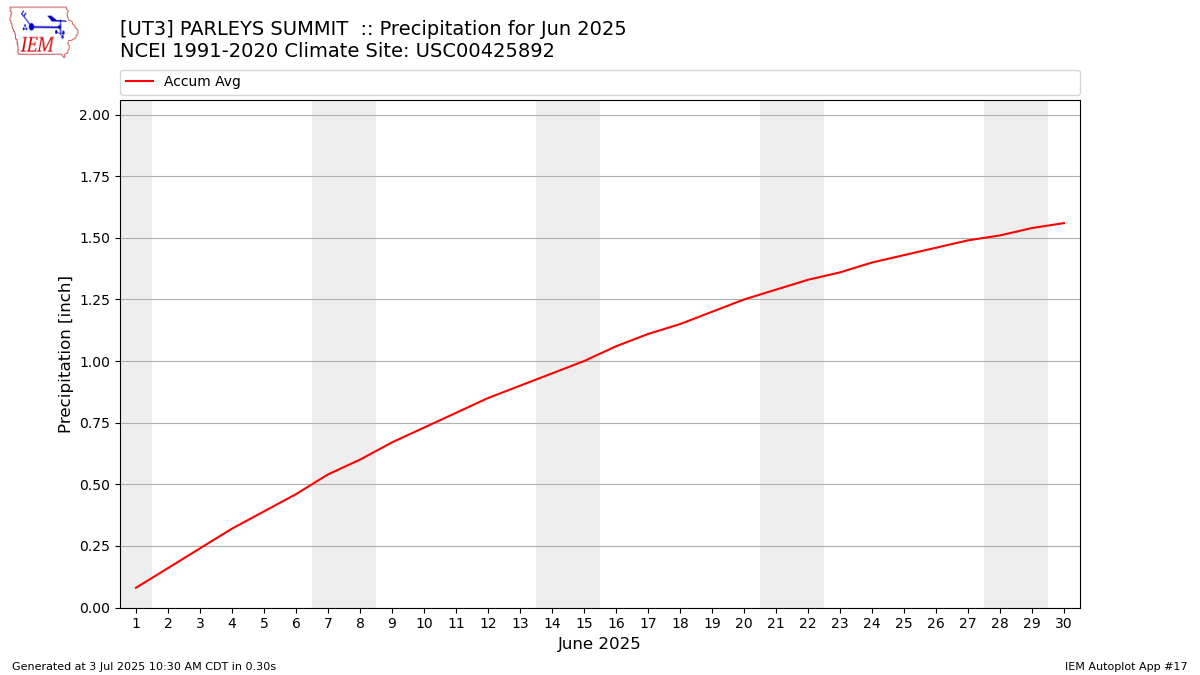
Description: This chart is of daily precipitation for the month. The red line would be an average month while the blue line and bars are observations.
Daily Average Wind Speeds
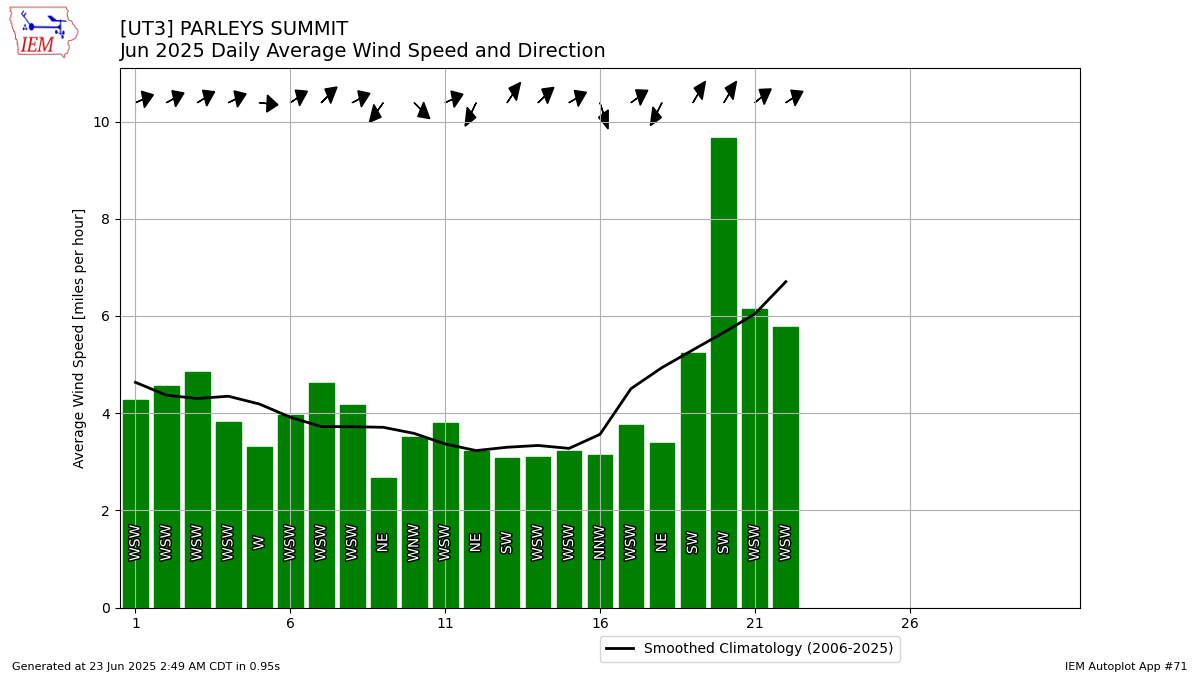
Description: This chart is of the daily average wind speeds.
The data presented here provided by IEM API webservice: daily.json. A simple CSV option exists as well.