| May 2025 | Jun 2025 | Jul 2025 | ||||
|---|---|---|---|---|---|---|
| Sunday | Monday | Tuesday | Wednesday | Thursday | Friday | Saturday |
| 01 High: 87.79999 Low: 58.35921 Precip: M Avg Wind: SSE @ 8.6 Gust: 35 (7:40 PM) RH% Min/Max: 15-51 Feel Min/Max: 58 to 84 | 02 High: 72.35958 Low: 54.550415 Precip: M Avg Wind: N @ 7.7 Gust: 28 (1:10 AM) RH% Min/Max: 18-59 Feel Min/Max: 55 to 72 | 03 High: 69.0494 Low: 44.799774 Precip: M Avg Wind: WSW @ 5.7 Gust: 21 (4:20 PM) RH% Min/Max: 22-51 Feel Min/Max: 42 to 69 | 04 High: 71.319176 Low: 44.439808 Precip: M Avg Wind: ESE @ 5.1 Gust: 16 (10:20 PM) RH% Min/Max: 20-59 Feel Min/Max: 41 to 71 | 05 High: 73.04002 Low: 47.58981 Precip: M Avg Wind: SSE @ 5.5 Gust: 18 (3:00 PM) RH% Min/Max: 19-60 Feel Min/Max: 43 to 73 | 06 High: 76.8308 Low: 53.909584 Precip: M Avg Wind: SE @ 4.9 Gust: 18 (2:30 PM) RH% Min/Max: 21-49 Feel Min/Max: 54 to 77 | 07 High: 80.70079 Low: 53.4308 Precip: M Avg Wind: SSE @ 5.7 Gust: 18 (2:40 PM) RH% Min/Max: 21-48 Feel Min/Max: 53 to 80 |
| 08 High: 82.70058 Low: 57.009212 Precip: M Avg Wind: E @ 7.6 Gust: 21 (7:40 PM) RH% Min/Max: 25-54 Feel Min/Max: 57 to 81 | 09 High: 87.40041 Low: 55.540394 Precip: M Avg Wind: SE @ 6.5 Gust: 15 (5:20 AM) RH% Min/Max: 13-54 Feel Min/Max: 56 to 84 | 10 High: 85.20079 Low: 59.910812 Precip: M Avg Wind: SSE @ 6.5 Gust: 24 (2:30 PM) RH% Min/Max: 17-47 Feel Min/Max: 60 to 82 | 11 High: 87.79999 Low: 59.779415 Precip: M Avg Wind: E @ 10.9 Gust: 32 (5:00 PM) RH% Min/Max: 19-56 Feel Min/Max: 60 to 84 | 12 High: 84.9002 Low: 56.679787 Precip: M Avg Wind: E @ 8.5 Gust: 29 (9:20 PM) RH% Min/Max: 24-76 Feel Min/Max: 57 to 82 | 13 High: 85.6994 Low: 53.180588 Precip: M Avg Wind: SSE @ 6.8 Gust: 26 (4:00 PM) RH% Min/Max: 18-79 Feel Min/Max: 53 to 83 | 14 High: 86.79919 Low: 58.46001 Precip: M Avg Wind: SSE @ 7.1 Gust: 22 (3:30 PM) RH% Min/Max: 14-45 Feel Min/Max: 58 to 83 |
| 15 High: 87.299614 Low: 56.24962 Precip: M Avg Wind: SSE @ 7.4 Gust: 25 (2:50 PM) RH% Min/Max: 9-53 Feel Min/Max: 56 to 84 | 16 High: 82.999405 Low: 57.590607 Precip: M Avg Wind: ESE @ 6.7 Gust: 15 (7:10 AM) RH% Min/Max: 15-47 Feel Min/Max: 58 to 80 | 17 High: 70.300415 Low: 62.24002 Precip: M Gust: 9 (2:00 AM) RH% Min/Max: 26-40 Feel Min/Max: 62 to 70 | 18 Precip: M | 19 | 20 | 21 |
| 22 | 23 | 24 | 25 | 26 | 27 | 28 |
| 29 | 30 | 01 | 02 | 03 | 04 | 05 |
The data presented here provided by IEM API webservice: daily.json. A simple CSV option exists as well.
Daily High/Low Plot
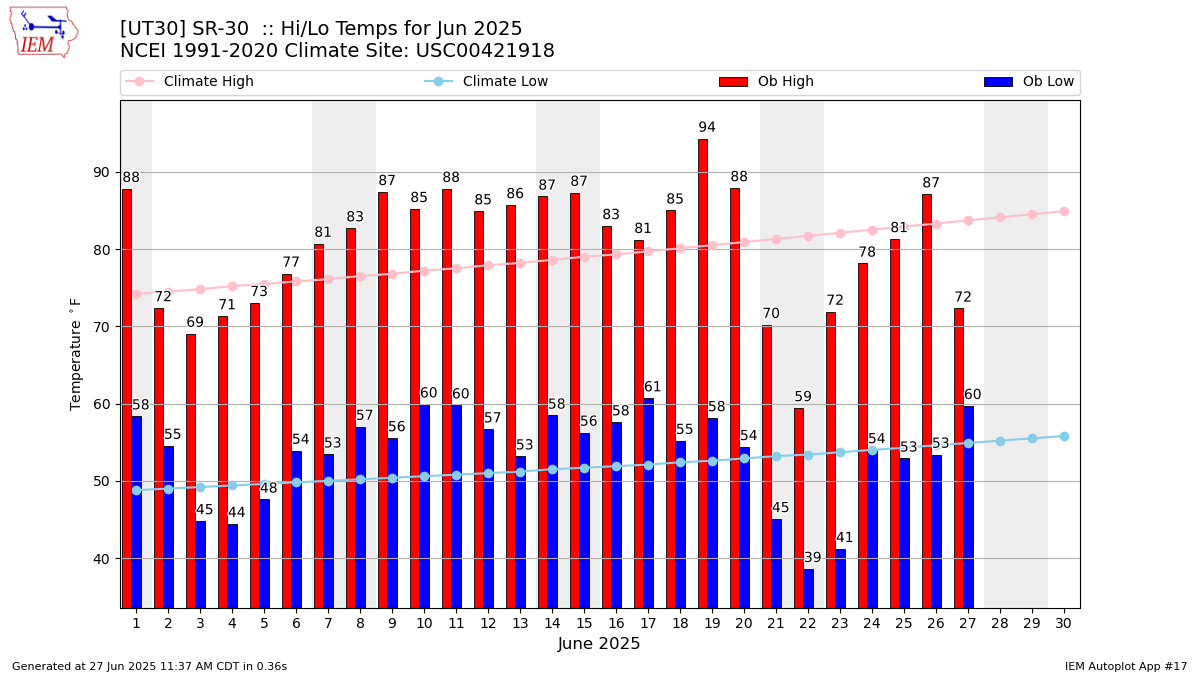
Description: This chart of the monthly temperature data. The bars are the observations and the dots are climatology.
Daily Rainfall
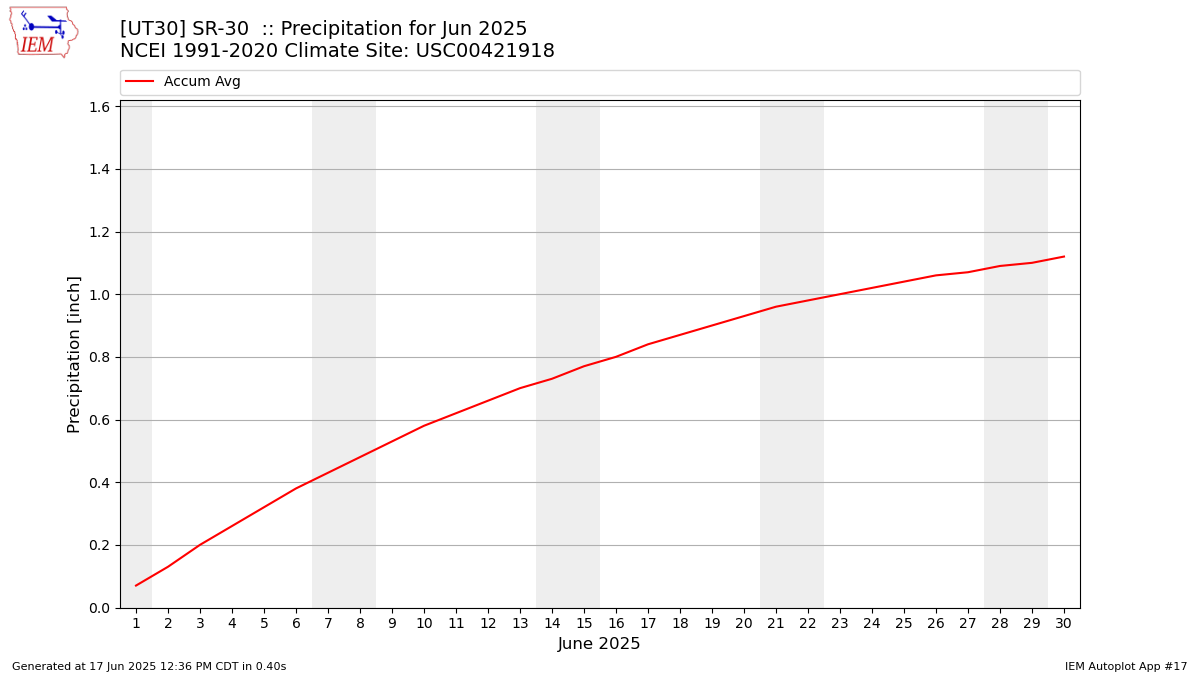
Description: This chart is of daily precipitation for the month. The red line would be an average month while the blue line and bars are observations.
Daily Average Wind Speeds
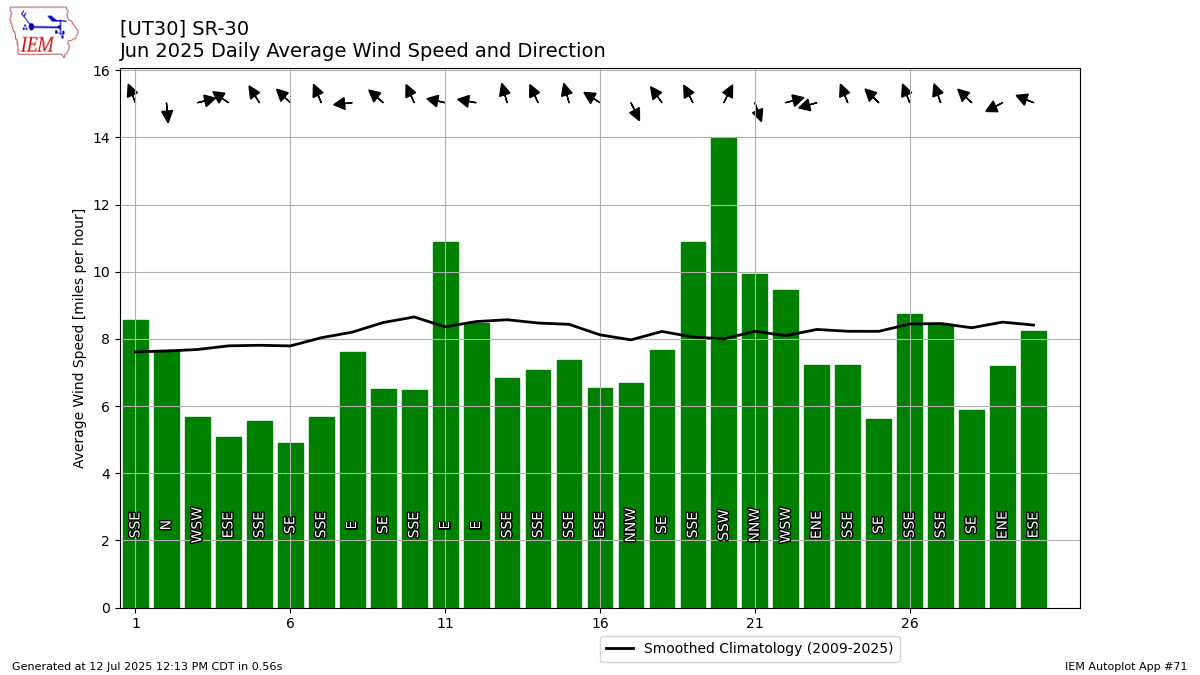
Description: This chart is of the daily average wind speeds.
The data presented here provided by IEM API webservice: daily.json. A simple CSV option exists as well.