| May 2025 | Jun 2025 | Jul 2025 | ||||
|---|---|---|---|---|---|---|
| Sunday | Monday | Tuesday | Wednesday | Thursday | Friday | Saturday |
| 01 High: 91.59978 Low: 63.06081 Precip: M Avg Wind: ENE @ 6.0 Gust: 28 (9:40 PM) RH% Min/Max: 13-40 Feel Min/Max: 63 to 87 | 02 High: 78.5606 Low: 56.710384 Precip: M Avg Wind: ENE @ 8.0 Gust: 22 (3:40 AM) RH% Min/Max: 14-49 Feel Min/Max: 57 to 79 | 03 High: 71.6792 Low: 47.530373 Precip: M Avg Wind: NE @ 10.0 Gust: 25 (4:30 PM) RH% Min/Max: 19-50 Feel Min/Max: 42 to 72 | 04 High: 73.1606 Low: 48.630215 Precip: M Avg Wind: ENE @ 8.7 Gust: 24 (5:10 PM) RH% Min/Max: 22-50 Feel Min/Max: 43 to 73 | 05 High: 76.11081 Low: 52.309425 Precip: M Avg Wind: NE @ 7.8 Gust: 23 (12:00 AM) RH% Min/Max: 21-40 Feel Min/Max: 52 to 76 | 06 High: 78.08 Low: 53.560383 Precip: M Avg Wind: ENE @ 7.8 Gust: 26 (3:40 PM) RH% Min/Max: 16-45 Feel Min/Max: 54 to 78 | 07 High: 82.799614 Low: 57.419605 Precip: M Avg Wind: ENE @ 7.8 Gust: 26 (3:50 AM) RH% Min/Max: 18-40 Feel Min/Max: 57 to 80 |
| 08 High: 85.60042 Low: 62.580215 Precip: M Avg Wind: NNE @ 6.7 Gust: 21 (3:30 PM) RH% Min/Max: 15-42 Feel Min/Max: 63 to 83 | 09 High: 88.89983 Low: 66.54919 Precip: M Avg Wind: NE @ 10.4 Gust: 31 (6:20 AM) RH% Min/Max: 18-40 Feel Min/Max: 67 to 86 | 10 High: 89.90057 Low: 63.190395 Precip: M Avg Wind: ENE @ 8.2 Gust: 25 (3:30 AM) RH% Min/Max: 18-39 Feel Min/Max: 63 to 86 | 11 High: 93.7994 Low: 66.95058 Precip: M Avg Wind: E @ 7.8 Gust: 26 (2:10 PM) RH% Min/Max: 14-38 Feel Min/Max: 67 to 89 | 12 High: 88.80079 Low: 68.6606 Precip: M Avg Wind: NE @ 10.3 Gust: 29 (1:40 AM) RH% Min/Max: 16-44 Feel Min/Max: 69 to 85 | 13 High: 90.699776 Low: 60.799988 Precip: M Avg Wind: ESE @ 9.4 Gust: 30 (2:30 PM) RH% Min/Max: 9-48 Feel Min/Max: 61 to 86 | 14 High: 91.39999 Low: 62.25079 Precip: M Avg Wind: E @ 8.9 Gust: 26 (2:40 PM) RH% Min/Max: 9-34 Feel Min/Max: 62 to 87 |
| 15 High: 92.49978 Low: 65.60958 Precip: M Avg Wind: ENE @ 11.6 Gust: 29 (7:20 AM) RH% Min/Max: 9-30 Feel Min/Max: 66 to 88 | 16 High: 88.199615 Low: 66.83 Precip: M Avg Wind: NNE @ 7.1 Gust: 25 (6:30 AM) RH% Min/Max: 11-30 Feel Min/Max: 67 to 84 | 17 High: 82.29919 Low: 61.280586 Precip: M Avg Wind: NE @ 8.2 Gust: 33 (12:20 AM) RH% Min/Max: 12-36 Feel Min/Max: 61 to 80 | 18 High: 81.60079 Low: 61.739594 Precip: M Gust: 26 (3:40 AM) RH% Min/Max: 23-39 Feel Min/Max: 62 to 80 | 19 Precip: M | 20 | 21 |
| 22 | 23 | 24 | 25 | 26 | 27 | 28 |
| 29 | 30 | 01 | 02 | 03 | 04 | 05 |
The data presented here provided by IEM API webservice: daily.json. A simple CSV option exists as well.
Daily High/Low Plot
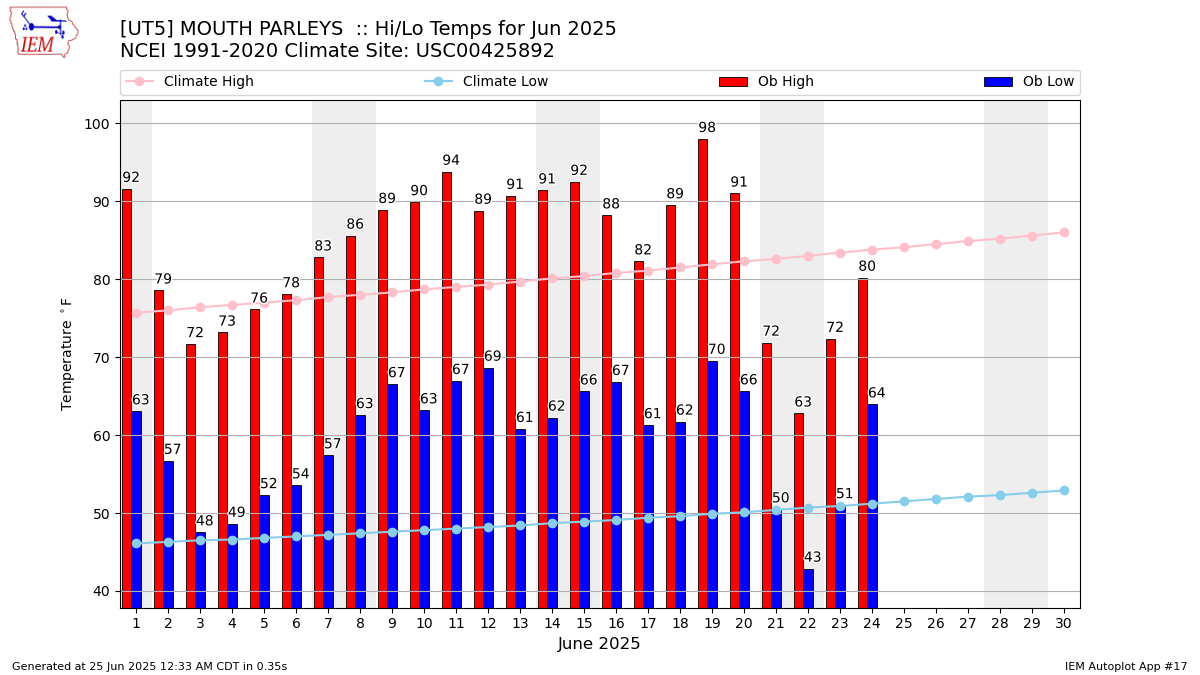
Description: This chart of the monthly temperature data. The bars are the observations and the dots are climatology.
Daily Rainfall
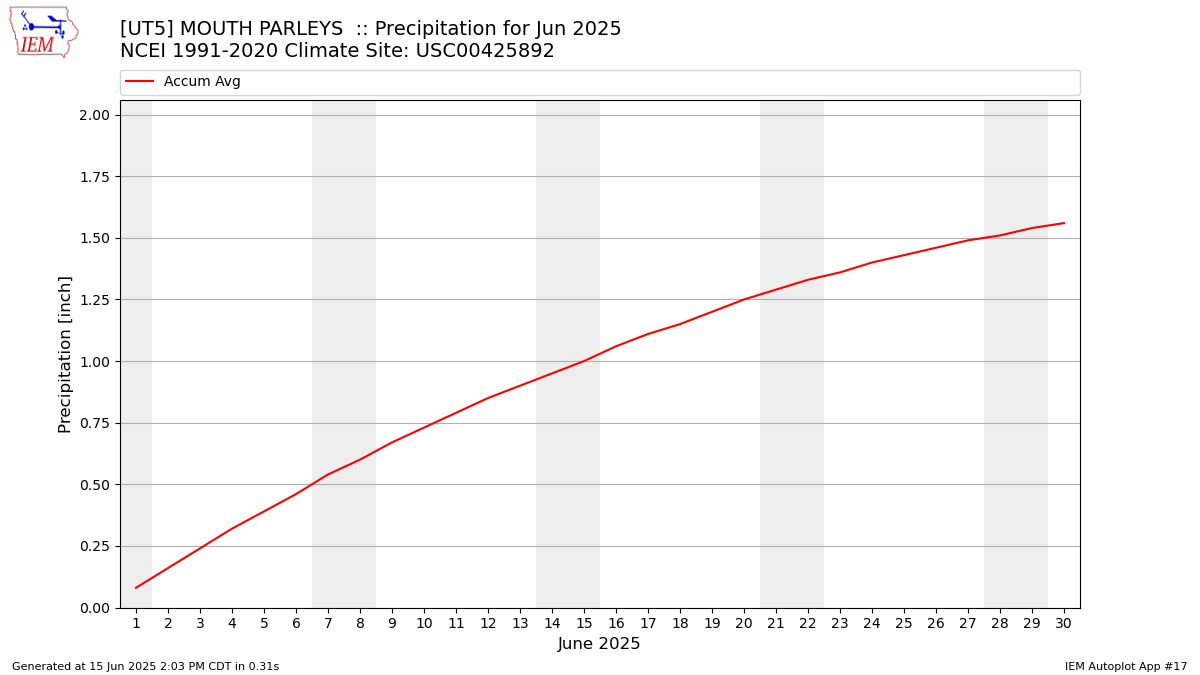
Description: This chart is of daily precipitation for the month. The red line would be an average month while the blue line and bars are observations.
Daily Average Wind Speeds
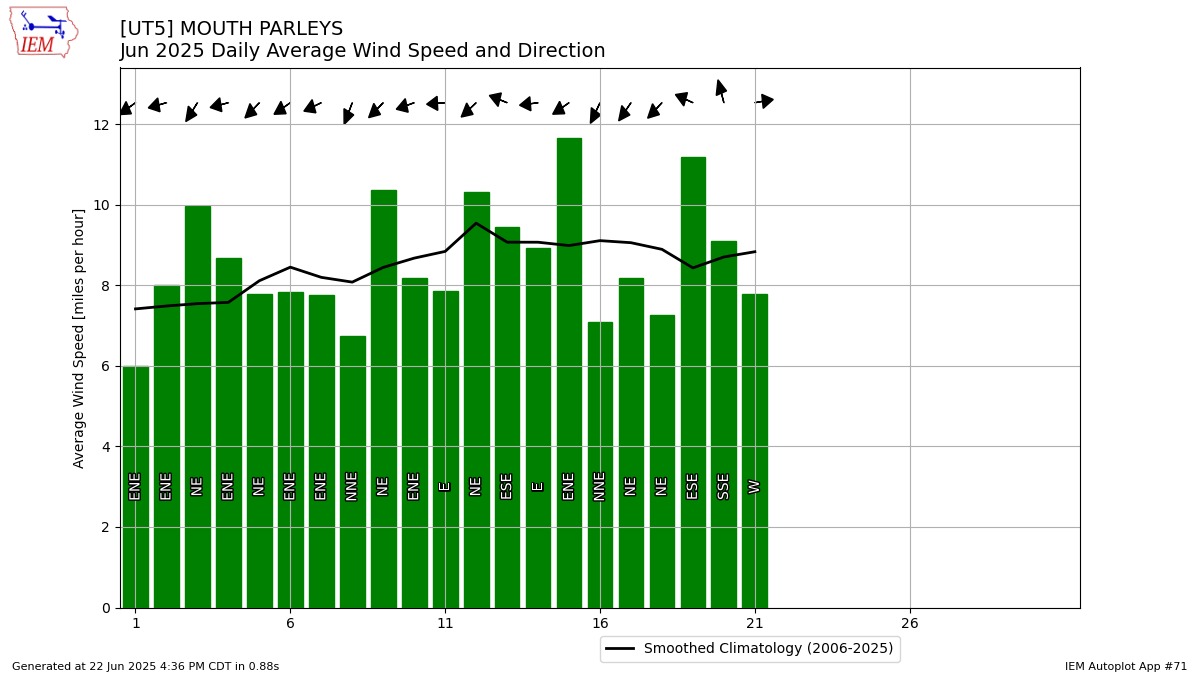
Description: This chart is of the daily average wind speeds.
The data presented here provided by IEM API webservice: daily.json. A simple CSV option exists as well.