| May 2025 | Jun 2025 | Jul 2025 | ||||
|---|---|---|---|---|---|---|
| Sunday | Monday | Tuesday | Wednesday | Thursday | Friday | Saturday |
| 01 High: 69.0404 Low: 55.21998 Precip: M Avg Wind: W @ 6.5 Gust: 46 (2:20 PM) RH% Min/Max: 18-36 Feel Min/Max: 55 to 69 | 02 High: 59.410385 Low: 47.3792 Precip: M Avg Wind: W @ 3.8 Gust: 22 (7:40 PM) RH% Min/Max: 31-99 Feel Min/Max: 45 to 59 | 03 High: 64.20921 Low: 45.590023 Precip: M Avg Wind: WSW @ 5.0 Gust: 26 (6:50 PM) RH% Min/Max: 19-69 Feel Min/Max: 44 to 64 | 04 High: 53.52078 Low: 44.16982 Precip: M Avg Wind: WSW @ 6.6 Gust: 30 (11:10 AM) RH% Min/Max: 59-84 Feel Min/Max: 38 to 54 | 05 High: 51.999775 Low: 42.729786 Precip: M Avg Wind: SW @ 7.1 Gust: 23 (11:30 AM) RH% Min/Max: 52-88 Feel Min/Max: 38 to 52 | 06 High: 53.589222 Low: 42.61998 Precip: M Avg Wind: SW @ 5.2 Gust: 18 (7:30 PM) RH% Min/Max: 46-82 Feel Min/Max: 40 to 54 | 07 High: 62.299404 Low: 43.340023 Precip: M Avg Wind: SW @ 6.8 Gust: 31 (7:40 PM) RH% Min/Max: 37-67 Feel Min/Max: 40 to 62 |
| 08 High: 65.55921 Low: 52.649616 Precip: M Avg Wind: WNW @ 6.4 Gust: 25 (1:50 PM) RH% Min/Max: 24-56 Feel Min/Max: 53 to 66 | 09 High: 69.08 Low: 55.29018 Precip: M Avg Wind: WNW @ 6.6 Gust: 35 (8:30 PM) RH% Min/Max: 22-48 Feel Min/Max: 55 to 69 | 10 High: 67.670616 Low: 51.27078 Precip: M Avg Wind: WSW @ 5.6 Gust: 26 (7:20 PM) RH% Min/Max: 21-43 Feel Min/Max: 51 to 68 | 11 High: 69.76038 Low: 58.040607 Precip: M Avg Wind: SW @ 9.0 Gust: 30 (3:40 PM) RH% Min/Max: 23-55 Feel Min/Max: 58 to 70 | 12 High: 70.12942 Low: 58.3808 Precip: M Avg Wind: SSW @ 9.7 Gust: 37 (4:50 PM) RH% Min/Max: 16-33 Feel Min/Max: 58 to 70 | 13 High: 69.710014 Low: 55.200203 Precip: M Avg Wind: SSW @ 12.1 Gust: 36 (5:20 PM) RH% Min/Max: 13-31 Feel Min/Max: 55 to 70 | 14 High: 72.19039 Low: 55.360382 Precip: M Avg Wind: SSW @ 9.5 Gust: 31 (6:00 PM) RH% Min/Max: 11-23 Feel Min/Max: 55 to 72 |
| 15 High: 74.19919 Low: 59.770405 Precip: M Avg Wind: SSW @ 9.4 Gust: 29 (3:50 PM) RH% Min/Max: 6-23 Feel Min/Max: 60 to 74 | 16 High: 73.70959 Low: 60.220406 Precip: M Avg Wind: SSW @ 11.3 Gust: 40 (2:10 PM) RH% Min/Max: 8-14 Feel Min/Max: 60 to 74 | 17 High: 71.00063 Low: 55.839222 Precip: M Avg Wind: WNW @ 7.5 Gust: 31 (4:00 PM) RH% Min/Max: 9-25 Feel Min/Max: 56 to 71 | 18 High: 72.62963 Low: 54.559425 Precip: M Avg Wind: WNW @ 9.1 Gust: 25 (3:30 PM) RH% Min/Max: 14-29 Feel Min/Max: 55 to 73 | 19 High: 62.72062 Low: 60.13043 Precip: M Gust: 11 (12:00 AM) RH% Min/Max: 16-18 Feel Min/Max: 60 to 63 | 20 Precip: M | 21 |
| 22 | 23 | 24 | 25 | 26 | 27 | 28 |
| 29 | 30 | 01 | 02 | 03 | 04 | 05 |
The data presented here provided by IEM API webservice: daily.json. A simple CSV option exists as well.
Daily High/Low Plot
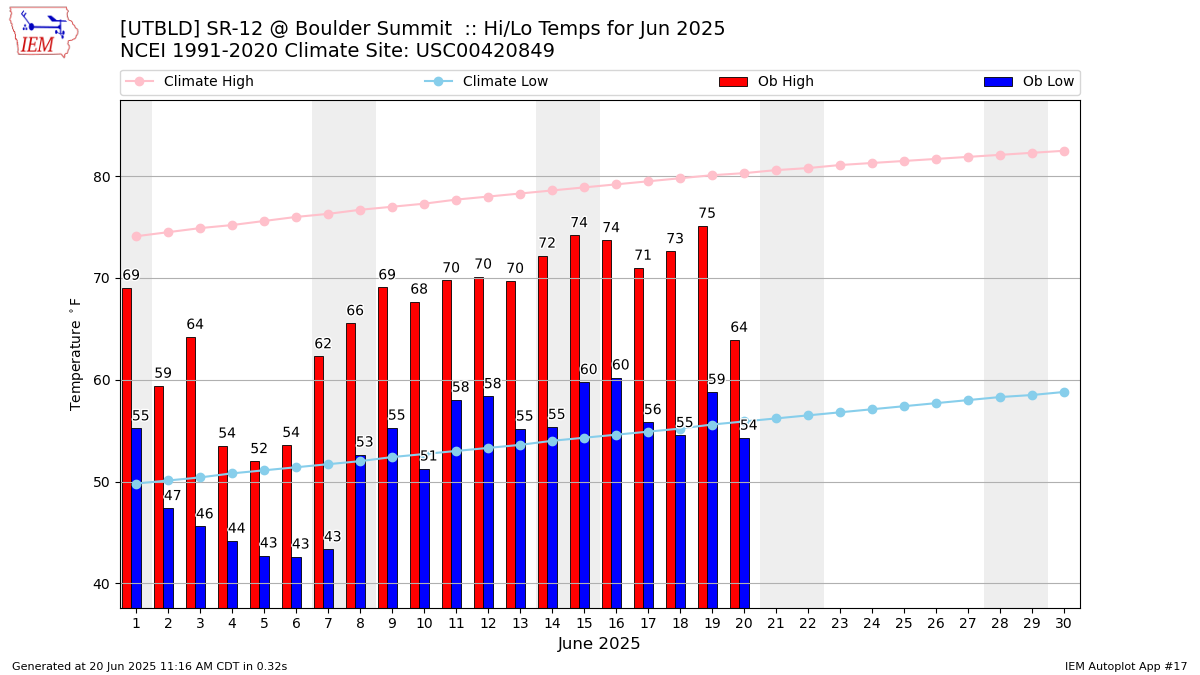
Description: This chart of the monthly temperature data. The bars are the observations and the dots are climatology.
Daily Rainfall
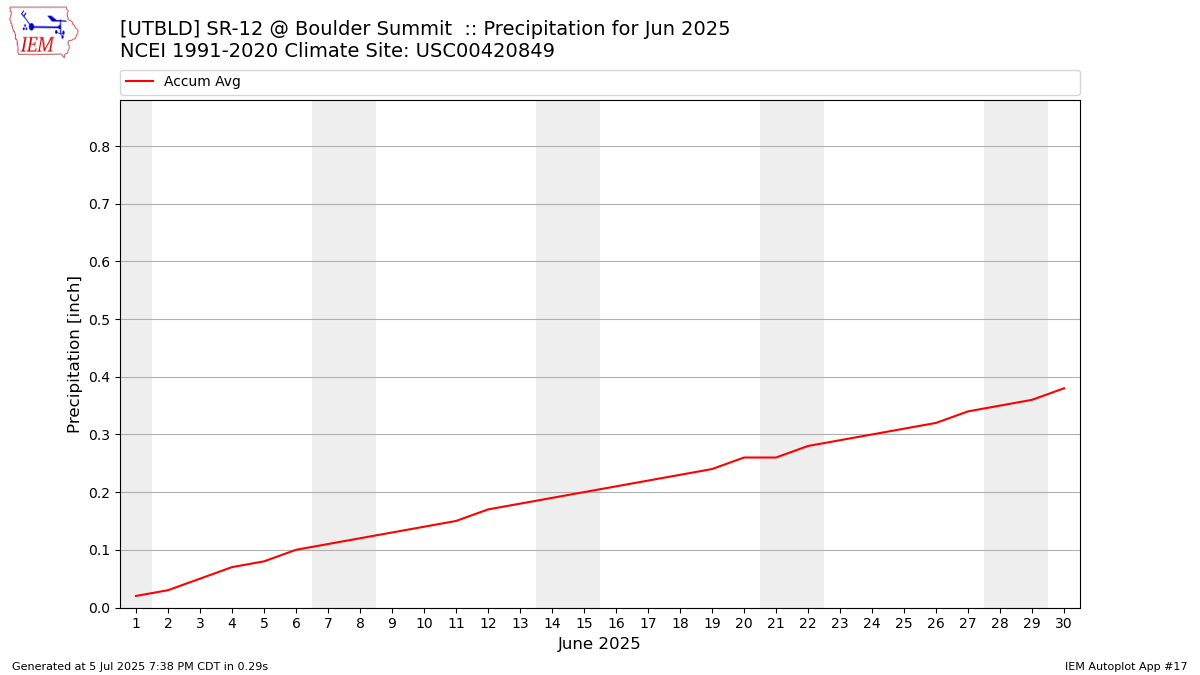
Description: This chart is of daily precipitation for the month. The red line would be an average month while the blue line and bars are observations.
Daily Average Wind Speeds

Description: This chart is of the daily average wind speeds.
The data presented here provided by IEM API webservice: daily.json. A simple CSV option exists as well.